FIG 1.
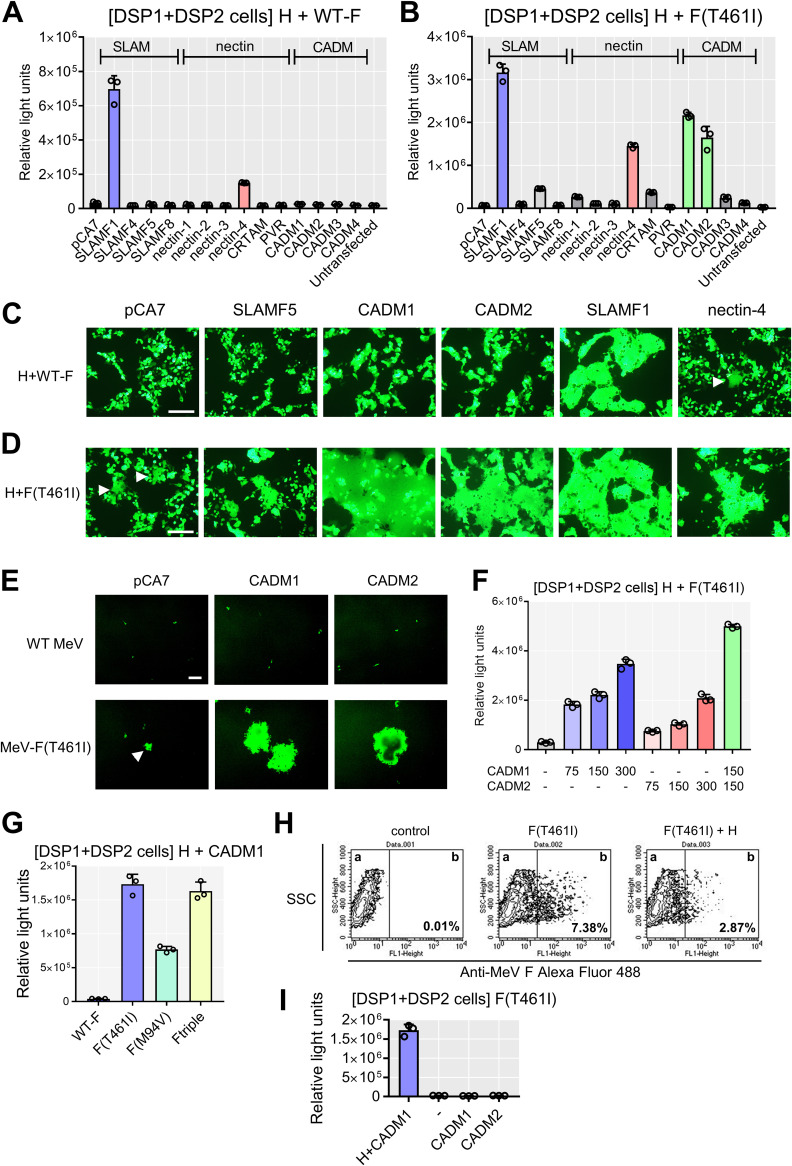
CADM1 and CADM2 induce membrane fusion with hyperfusogenic F proteins. (A and B) The DSP assay with host molecules using the WT F (A) or F(T461I) protein (B). pCA7 expression plasmids respectively encoding MeV H and MeV F proteins with pCA7 encoding a host protein or with pCA7 alone as a control were transfected into cocultured 293FT/DSP1 and 293FT/DSP2 cells [DSP1 + DSP2 cells]. (C and D) The fusion assays with host molecules using the WT F (C) or F(T461I) protein (D). pCA7 expression plasmids respectively encoding MeV H, MeV F, and EGFP with pCA7 encoding a host protein or pCA7 alone were transfected into 293FT cells. White arrowheads indicate small syncytia. (E) 293FT cells expressing CADM1 or CADM2 infected with WT MeV or MeV-F(T461I). pCA7, control plasmid. A white arrowhead indicates a small syncytium. (F) The DSP assay with the H and F(T461I) proteins using different amounts of plasmids encoding CADM1/2 (0 to ∼300 ng). (G) The DSP assay using various F proteins with the H and CADM1 proteins. (H) The F(T461I) protein was transiently expressed with or without the H protein in 293FT cells. Surface expression of the F protein was analyzed by flow cytometry. Percentages of the F protein-positive population in compartment b are shown. (I) CADM1 or CADM2 was expressed with the F(T461I) protein with or without the H protein in the DSP assay. n = 3; mean ± standard deviation (SD) (A, B, F, G, and I). Scale bar = 200 μm (C, D, and E).

