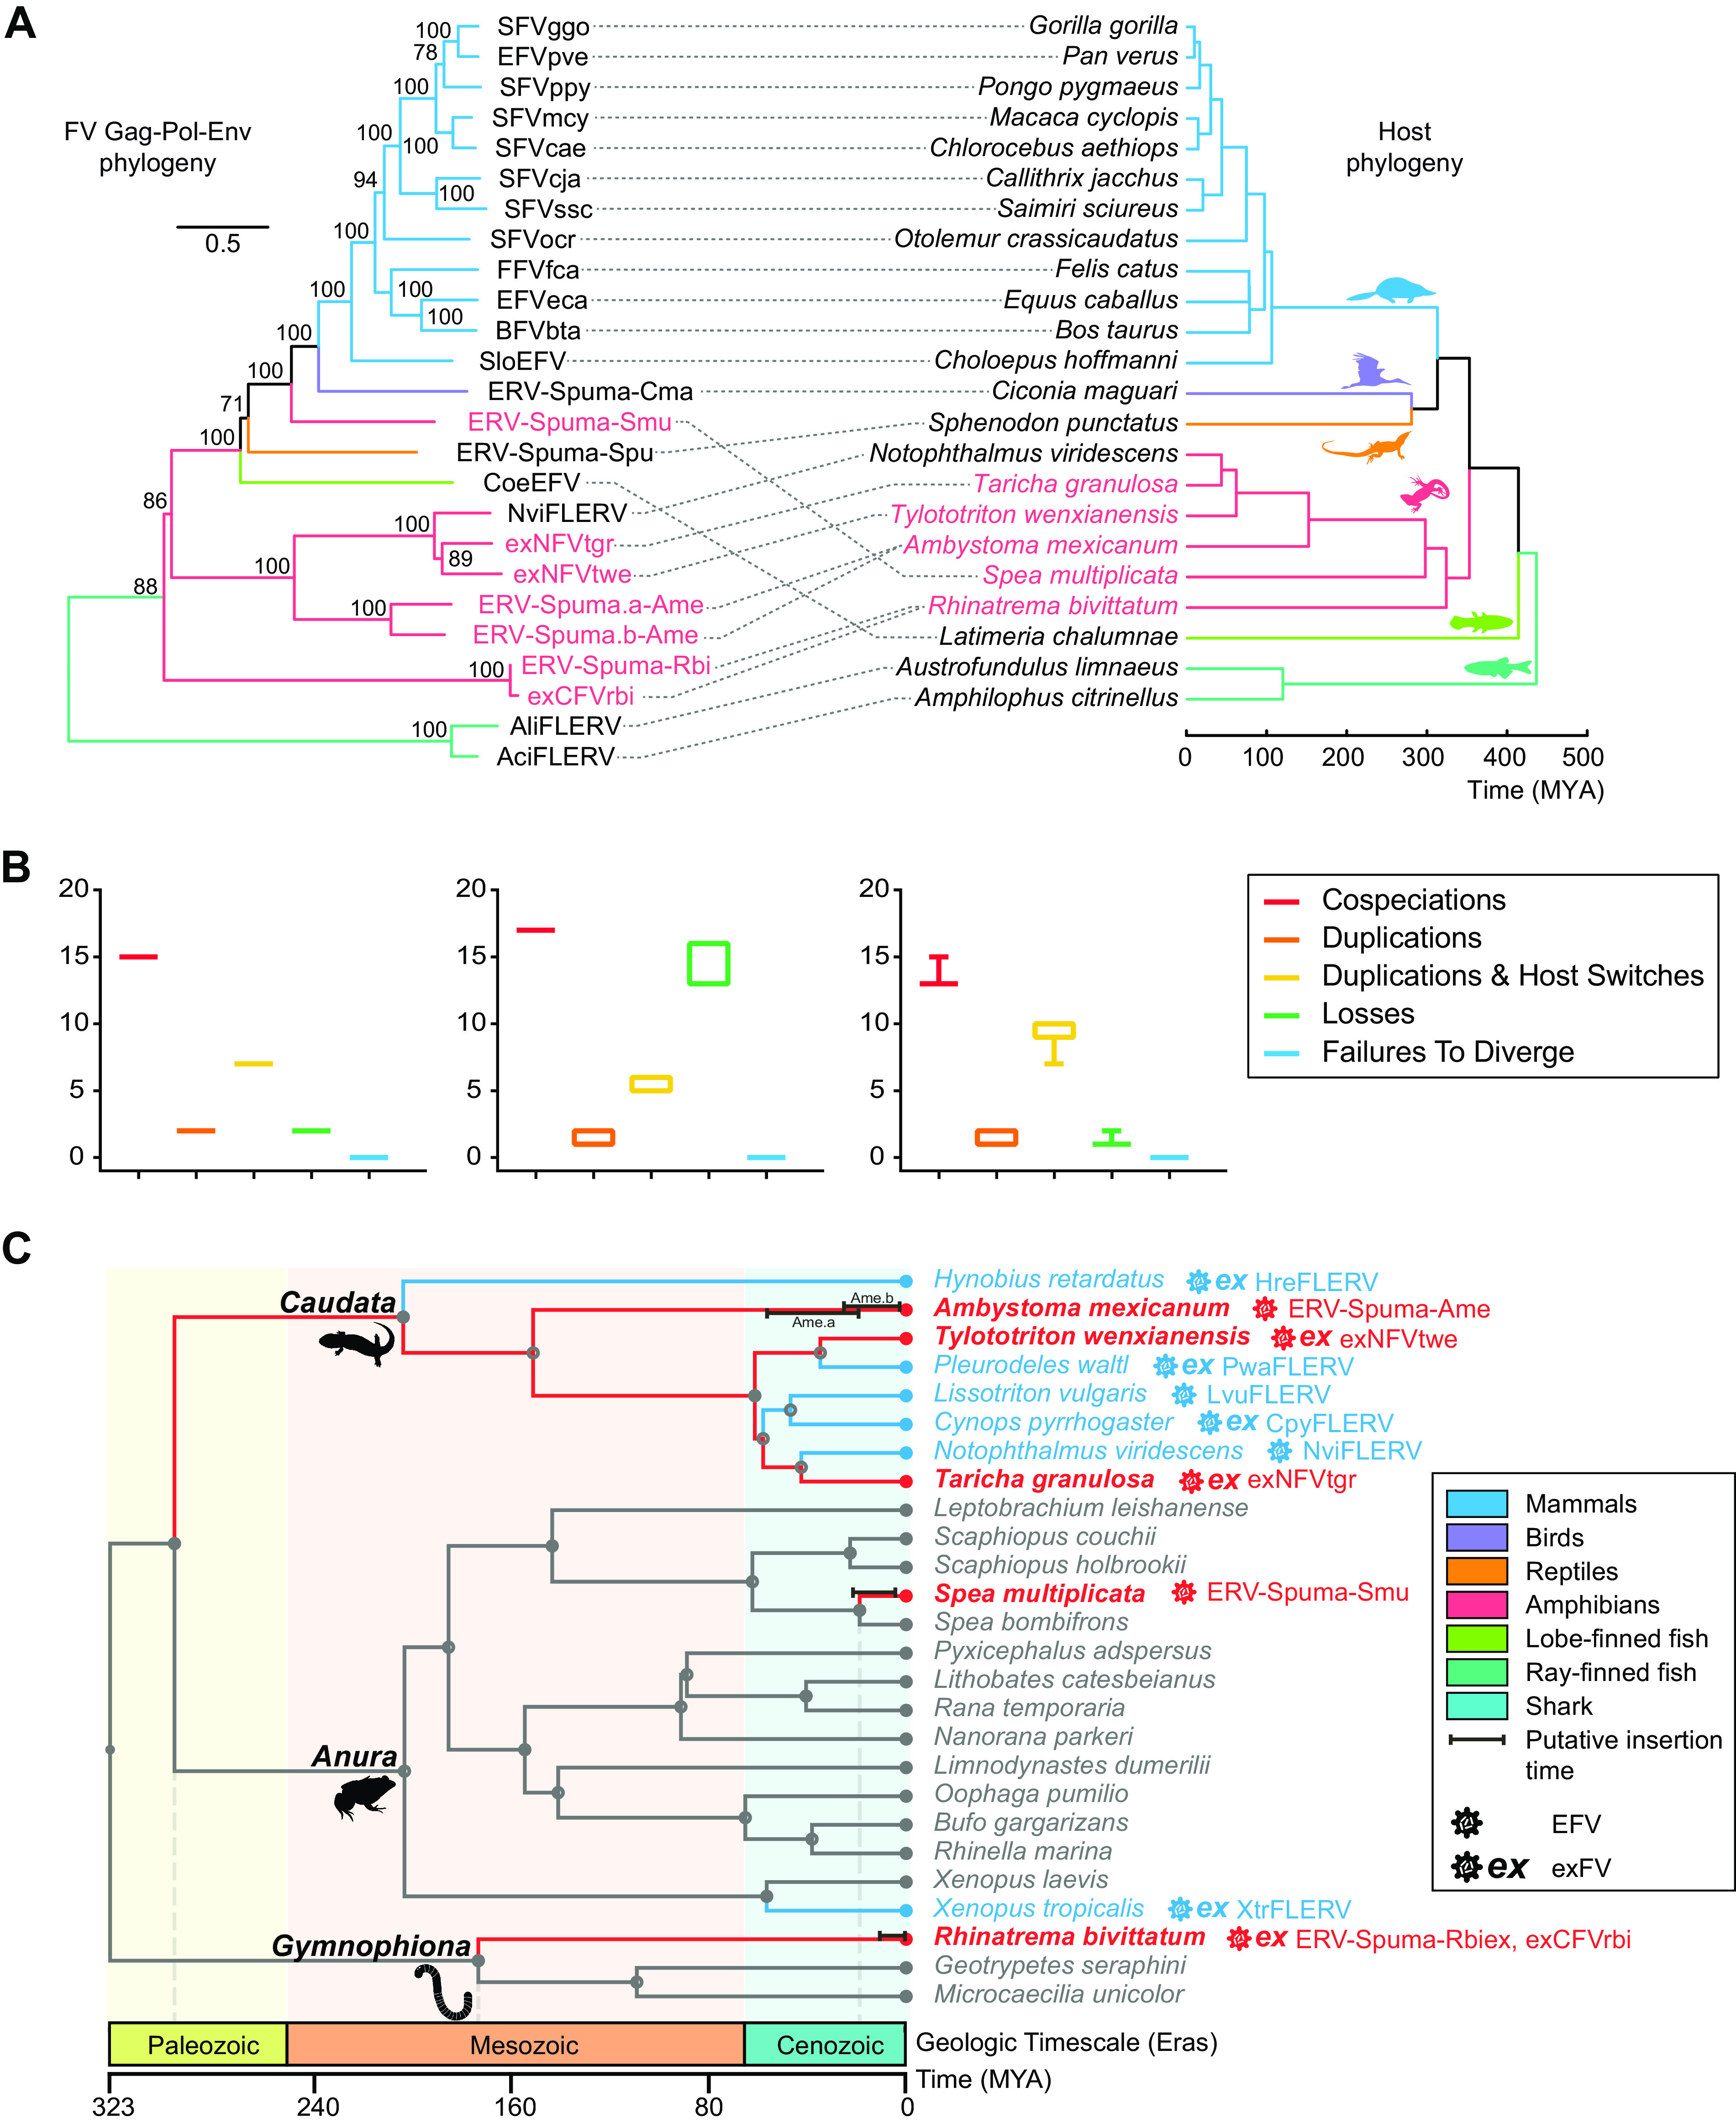
FIG 4.

Macroevolutionary history of foamy viruses and their vertebrate hosts. (A) Association between foamy viruses (left) and their hosts (right). Associations between foamy viruses and their hosts are indicated by connecting lines. The newly identified exFVs and EFVs and their hosts are indicated in red. Scale bars indicate the number of amino acid changes per site in the viruses and the host divergence times (million years ago [MYA]). Bootstrap values of <70% are not shown. (B) Reconciliation analysis of foamy virus using Jane. Cospeciations (red), duplications (orange), host-switching (yellow), losses (green), and failure-to-diverge (blue) events are shown. The cost parameters (cospeciation, duplication, duplication and host switch, loss, and failure to diverge, respectively) used in each test were as follows: −1, 0, 0, 0, 0 (left); 0, 1, 2, 1, 1 (middle); and 0, 1, 1, 2, 0 (right). (C) Calibration of foamy virus infection timeline. A time-calibrated phylogeny of screened amphibians was obtained from TimeTree (http://www.timetree.org/). Previous estimated endogenization intervals are indicated by blue lines, while our predictions are indicated by red lines. Closed circles on nodes indicate the existence of taxon rank names. The time range of LTR dating estimation for each foamy virus is indicated by a black bar.
