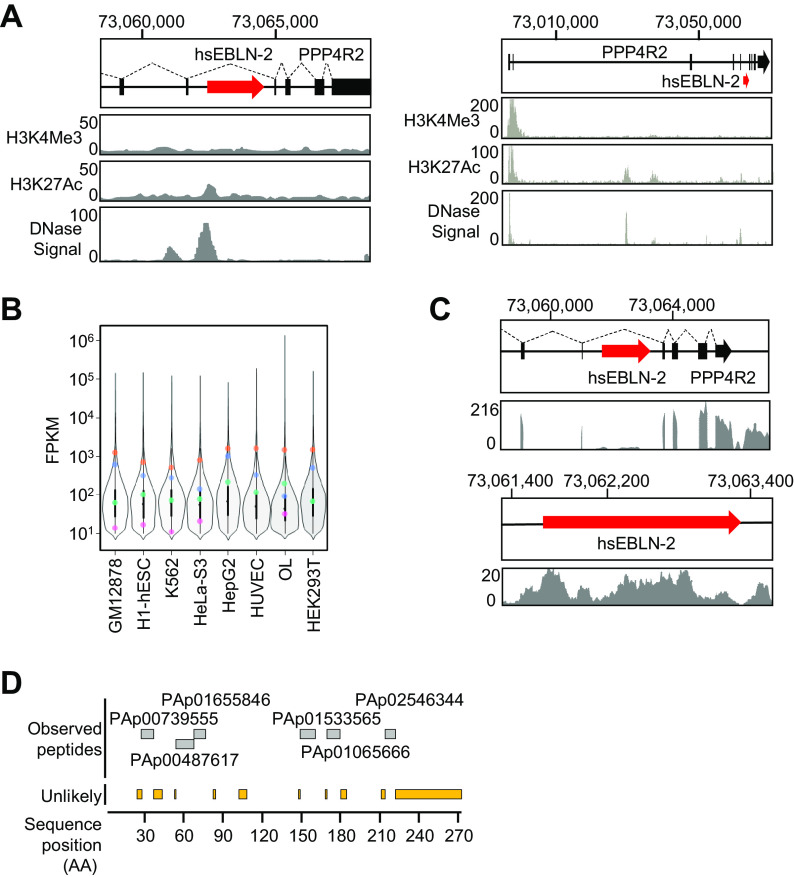
FIG 1.
Expression profile of hsEBLN-2 in the human genome. (A) A schematic diagram showing the position of hsEBLN-2 on human chromosome 3 (chr 3) at locus 3p13 and a UCSC genome browser view (UCSC Genome Browser on Human Assembly; December 2013) (53) showing coverage of H3K4me3 and H3K17Ac chromatin immunoprecipitation sequencing (ChIP-seq) reads and DNase hypersensitive sites of GM12878, H1-hESC, HSMM, HUVEC, K562, NHEK, and NHLF cells. (B) Expression level of hsEBLN-2 (pink), PPP4R2 (green), TOMM20 (orange), and HPRT1 (blue) RNAs in human-derived cell lines. Each violin plot and box plot show the distribution of the expression levels of genes in each cell line. (C) IGV genome browser view showing the depth of RNA-seq reads mapped to the genomic region of the hsEBLN-2 locus. (D) Sequences of the hsEBLN-2 region registered in the Peptide Atlas (http://www.peptideatlas.org/) are shown. Displayed peptides are observed from several tissues, including ovary, breast, and blood plasma.

