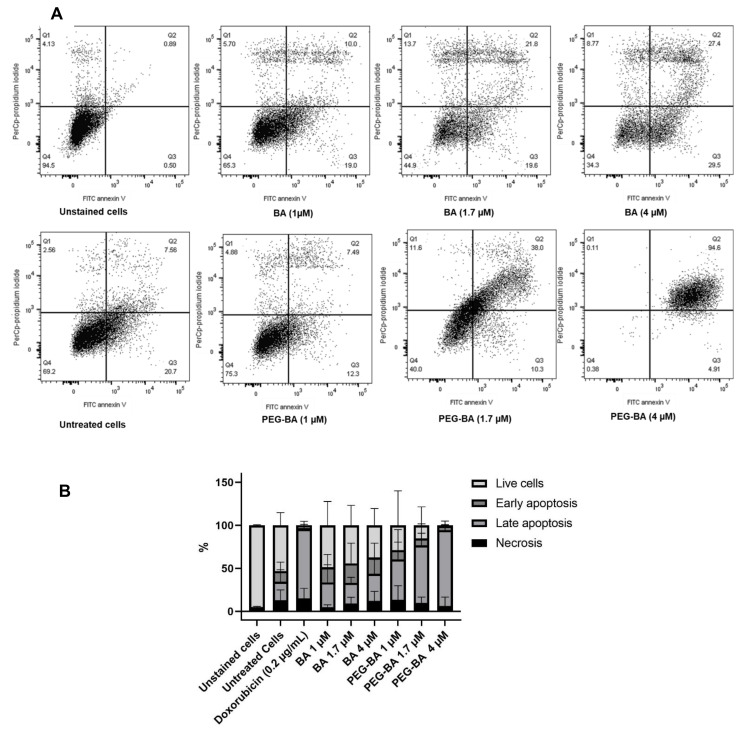
Figure 3.
Apoptotic and necrotic effect of BA and PEG–BA on MIA PaCa-2 cells. Representative dot plots showing apoptosis at varying concentrations of BA and PEG–BA are shown in A. The cells were treated with the compounds for 72 h, and cell death measured using Annexin V and propidium iodide staining by flow cytometry (A). Fluorescein isothiocyanate (FITC) channel detected annexin-V+ stained apoptotic cells (x-axis) while peridinin–chlorophyll–Protein (PerCP) channel detected propidium iodide or necrotic cells (y-axis). Apoptotic cells represented in Q2 and Q3 as late and early apoptosis were separated from necrotic cells in Q1 and live cells in Q4. (B) A quantitative stacked bar graph showing the apoptosis induced by BA and PEG–BA on MIA PaCa-2 cells. PEG–BA caused a higher percentage of apoptosis (mainly shown as late apoptosis) compared to free BA. The cells of interest were gated from singlet cells and debris using forward and side scatter properties. Untreated cells represent the vehicle control (DMSO), n = 3.

