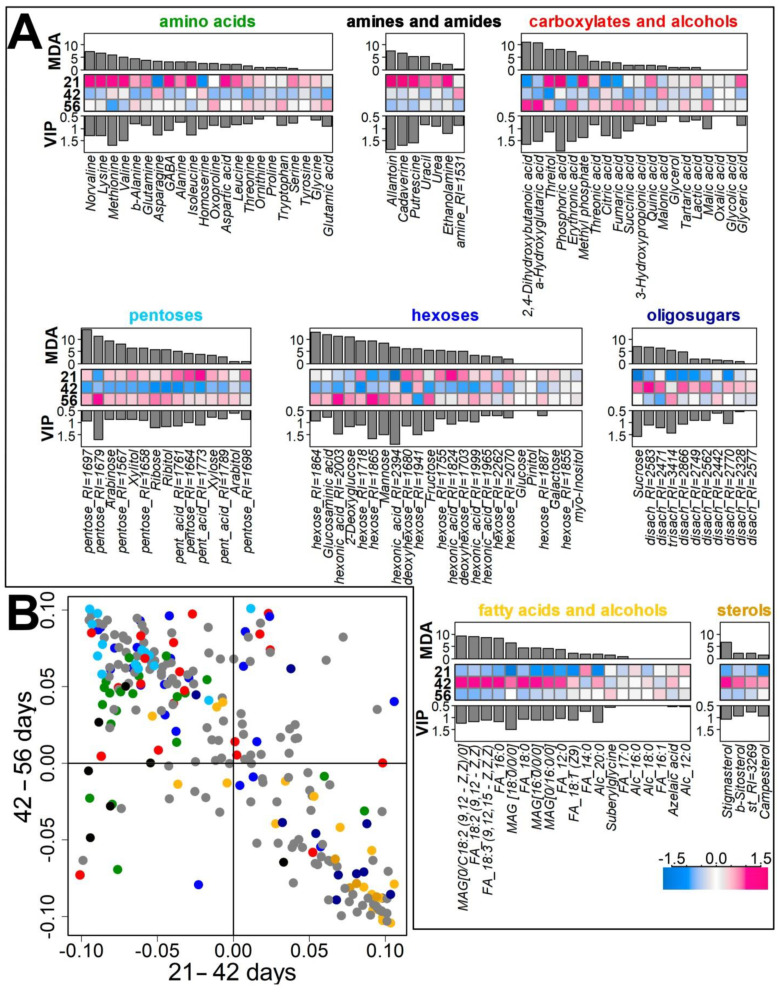
Figure 3.
Analysis of age dependence of metabolite profile diversity. (A) Heatmaps of arbitrary normalized metabolite levels in pea cv. Finale roots during development of control plants sampled at days 21, 42, and 56. The top barplots are Mean Decrease Accuracy (MDA) obtained by the Random Forest, the bottom barplots are VIPs from PLS-DA. (B) SUS-plot: metabolite scattering in the space of loadings from OPLS-DA models for comparing roots of 21 and 42 day old plants (abscissa) and 42 and 56 day old (ordinate); positive values correspond to higher level at a later stage. Colors mirror chemical classes. Grey circles correspond to unidentified metabolites. “MAG”—monoacylglycerol; “FA”—fatty acid; “Alc”—fatty alcohol; “st”—sterol; RI—Kovatc retention index.

