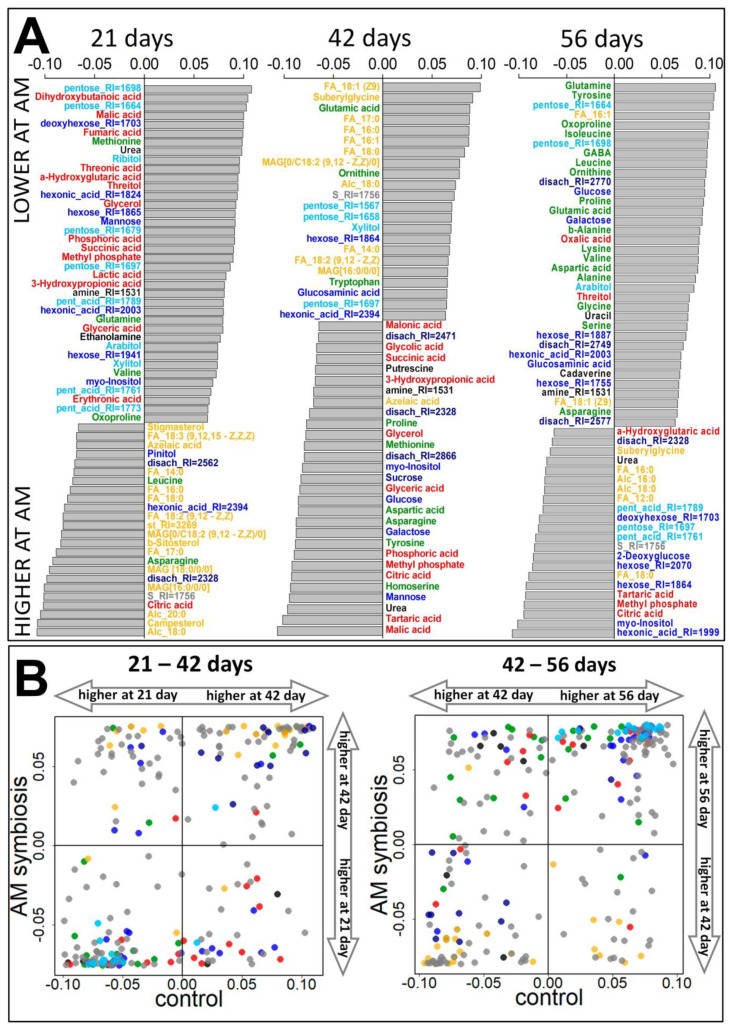
Figure 4.
Influence of mycorrhiza on the metabolome of pea cv. Finale roots sampled at 21, 42, and 56 day. (A) Barplots of the loadings of predictive components (VIP > 1) from OPLS-DA models for comparison of control and mycorrhized roots, positive values correspond to a higher content during mycorrhization. (B) Influence of mycorrhiza on the metabolome dynamics. Metabolites scattering in the space of the loadings from OPLS-DA models for comparing adjacent time points under control (abscissa) and mycorrhization (ordinate). Color code is the same as in Figure 3.

