Figure 5.
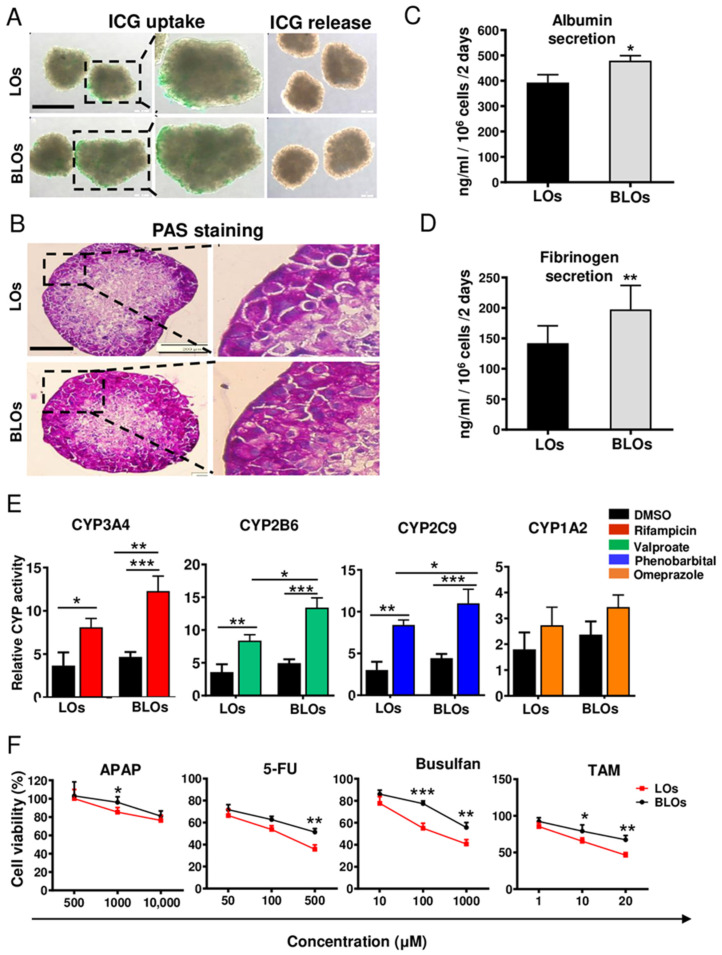
Functional assays of the LOs and BLOs derived from the hESC groups. (A) The BLOs and LOs groups were examined for their ability to take up and release indocyanine green (ICG). The ICG uptake and release took 1 and 3 h, respectively. Scale bar: 200 μm. (B) Periodic acid Schiff (PAS) staining was done to analyze glycogen storage. Scale bar: 200 μm. (C,D) Quantification of albumin (ALB) and fibrinogen secretion after 48 h. Data are shown as mean ± SD (n = 3). Statistical analysis was performed by using unpaired two-tailed Student’s t-tests. * p < 0.05 and ** p < 0.01. (E) Induction of CYP3A4, CYP2B6, CYP2C9, and CYP1A2 by rifampicin, valproate, phenobarbital, and omeprazole, respectively, after 72 h of treatment. (F) Cell viability in the BLOs and LOs groups was assessed by Orangu® kit after 48 h of exposure to different concentrations of hepatotoxic compounds, paracetamol (ATAP), fluorouracil (5-FU), busulfan, and tamoxifen (TAM). Data are shown as mean ± SD (n = 3). Statistical analysis was performed using one-way ANOVA, followed by Tukey posthoc. * p < 0.05, ** p < 0.01, and *** p< 0.001. LOs: liver organoids; BLOs: bioengineered liver organoids.

