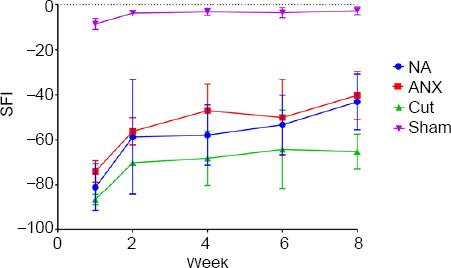
Figure 8.

Walking analysis of rats.
SFI measured in the four experimental groups at 1, 2, 4, 6 and 8 weeks after surgery, and the SFI value was calculated. In the 8th week, the results showed no significant difference between NA and ANX groups (P > 0.05). Data are shown as the mean ± SD (n = 7). ANX: Acellular nerve xenograft; NA: nerve autograft; ND: negative control; SFI: sciatic functional index.
