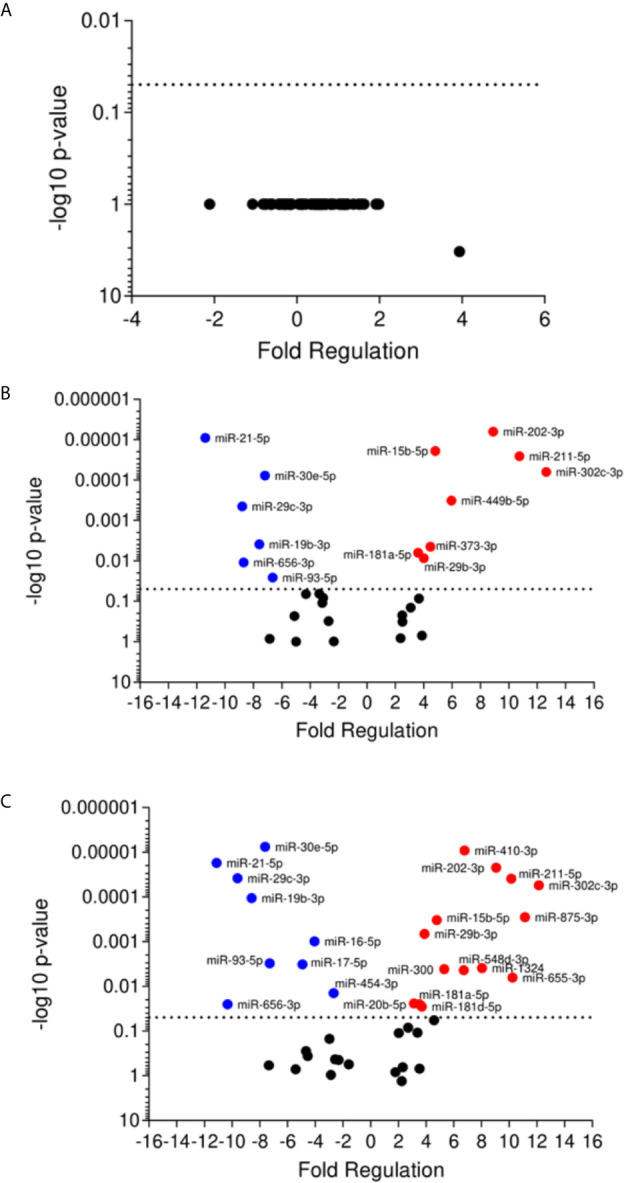
Figure 3.

Volcano plot of differential expression of miRNA in plasma of cutaneous leishmaniasis patients. Volcano plot of differential expression of miRNA in plasma samples of active disease patients (A) and self-healed (B) compared to healthy individuals, and self-healed (C) compared to active disease patients. Each dot represents one miRNA. Red dots indicate the up-regulated miRNAs, and the blue dots represent the down-regulated miRNAs (P < 0.05). Black dotted line corresponds to p=0.05, log 10. The relative up- and down-regulation of miRNAs, expressed as boundaries of 2 or -2 of Fold Regulation, respectively. P-value was determined based on two-tailed Student’s t test. P < 0.05 (Student t test and Bonferroni correction).
