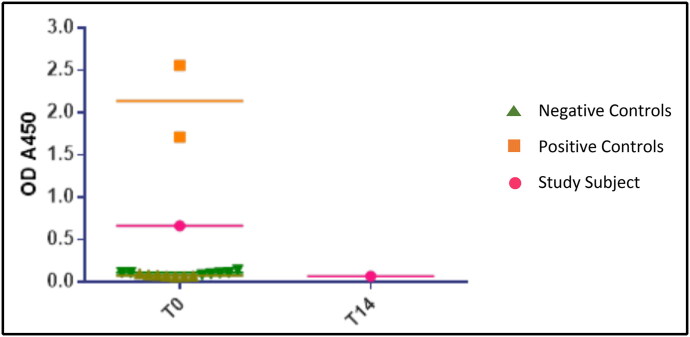
Figure 2.
A subject’s detectable antibody to RBD antigen signal (in pink) on the first week of testing (T0) and the loss of signal on testing 2 weeks later. Two different sets of negative controls (light and dark green) and a positive control (orange) are shown for comparison. The signals from positive control samples were considerably higher than those of the study subjects.

