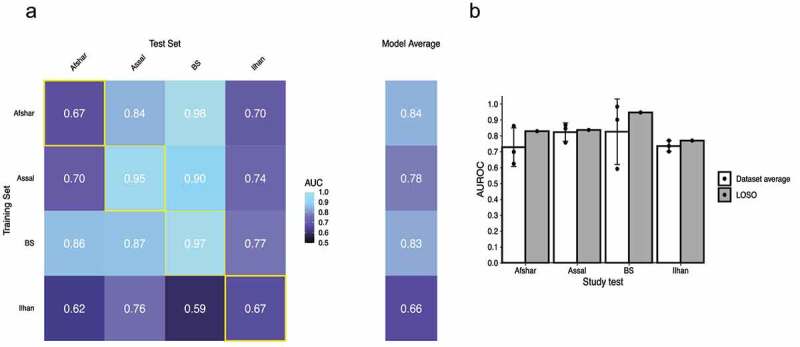
Figure 4.

Supervised Classification Using the Least Absolute Shrinkage and Selection Operator Logistic Regression Reveals that the Fecal Microbiota can be Used to Discriminate Pre- and Post-Samples Across 16S rRNA Gene Datasets. (a) The heatmap shows the area under the receiver operating characteristic curve (AUROC) from cross validations within each study (yellow boxes along diagonal) and study-to-study model transfer (external-validations off-diagonal). The last column shows the average AUROC for study-to-study predictions. (b) White bar plots show the AURC for a model trained on data from a single study predicting the test study on the X-axis. The bar height represents the average AURC for the 3 classifiers and the error bar represents the standard deviation. The gray bar plots show the AURC for a model trained on all studies but one (LOSO validation)
