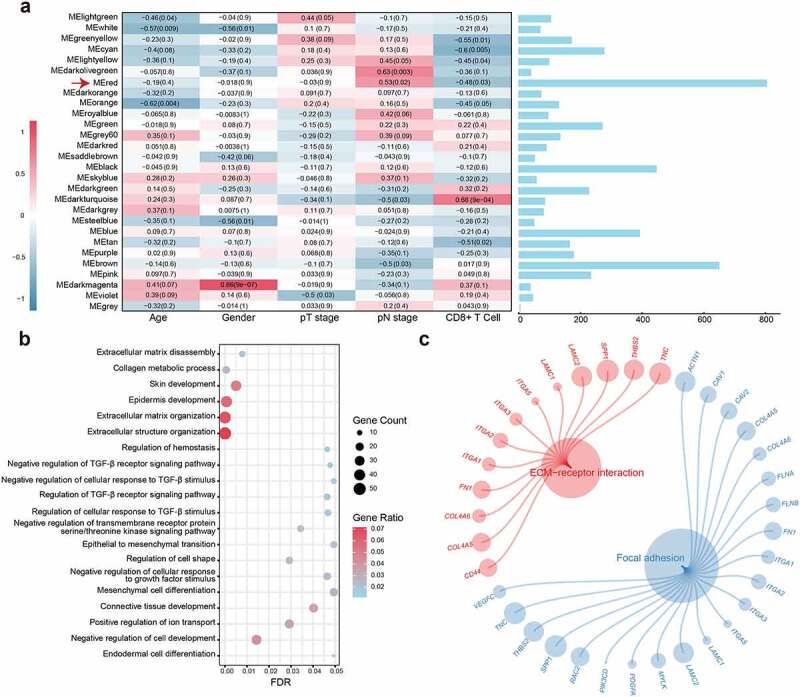
Figure 1.

WGCNA construction and biological function and pathway annotation. (a) Left: Correlation of module eigengenes to clinical and pathological traits. The values in the cells are presented as “Pearson r (p-value)”. P-values were obtained by Pearson’s correlation analyses; Right: The number of genes in each module. The red arrow represents the red module. (b) Gene ontology analysis of genes in the red module. (c) KEGG pathway enrichment analysis of genes in the red module
