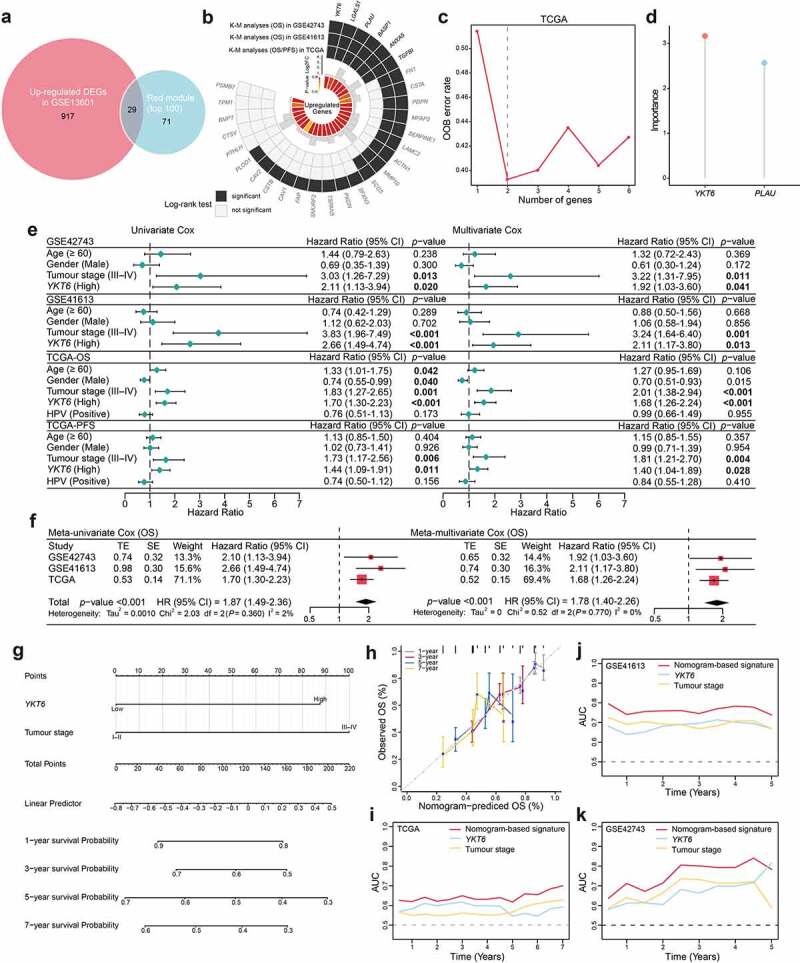
Figure 2.

Identification of YKT6 as a hub gene and construction of a YKT6-based prognostic prediction model. (a) Venn plot of intersection of up-regulated differentially expressed genes (DEGs) and selected genes from WGCNA. (b) Circos plot shows 29 common genes from WGCNA and differential expressed analysis in OSCC samples. Up-regulations of six genes are also associated with OS/PFS reduction in TCGA-HNSCC cohort. (c-d) Ranger provided VIS for two genes for TCGA-HNSCC patients only. OOB error rate of these genes in the model, when genes were included one by one based on their VIS ranks. The gene (red lollipop) that ranked in the top list according to the prognostic importance was chosen for further analyses. (e) Univariate and multivariate Cox regression analyses of YKT6 level with age, gender, tumour stage and HPV status in the GSE41613, GSE42743 and TCGA cohorts. HR and p-values were displayed. (f) Meta‐analysis of prognostic values of YKT6 for patients across three cohorts. A fixed effects model was used to calculate pooled HR value. (g) Nomogram by multivariate Cox regression analysis for predicting the proportion of patients with OS. (h) Plots depict the calibration of model in terms of agreement between predicted and observed OS. Model performance is shown by the plot, relative to the 45-degree line, which represents perfect prediction. (i-k) AUC plotted for different durations of OS for nomogram-based signature, YKT6 expression, and tumour stage in the TCGA, GSE41613 and GSE42743 datasets
