
Figure 6.
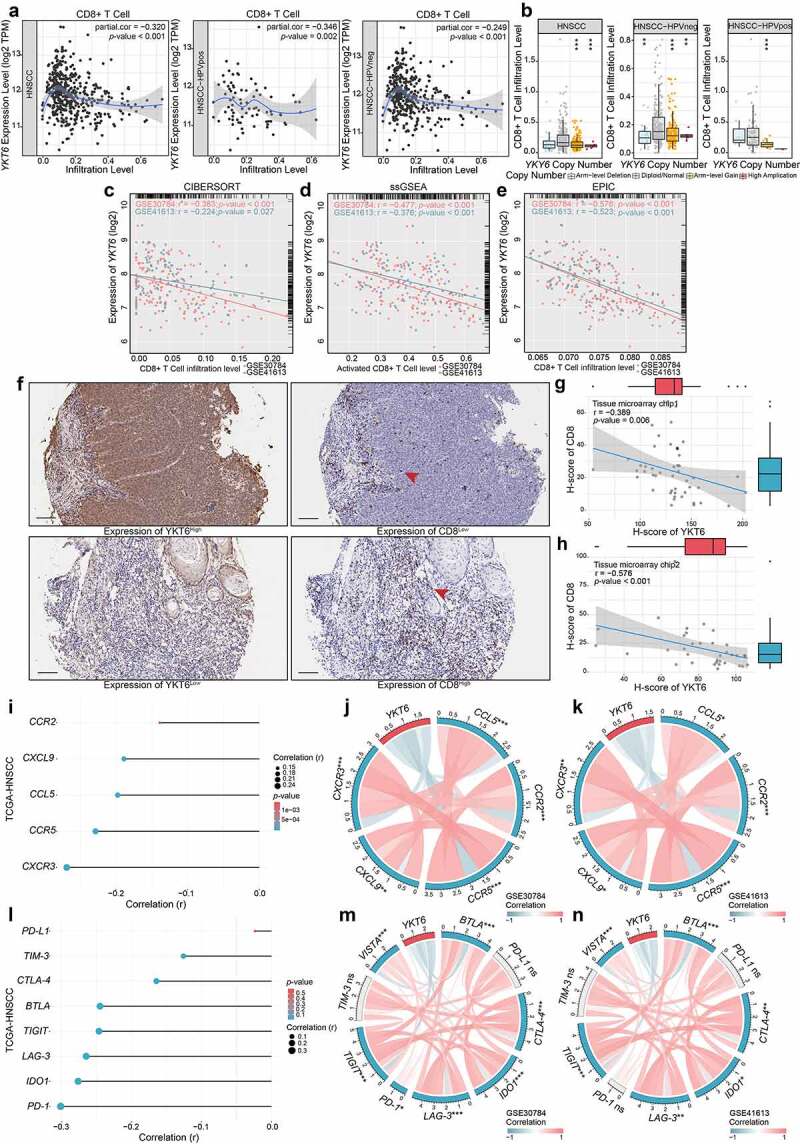
High expression of YKT6 correlates with low CD8+T cell infiltration level. (a) The mRNA expression of YKT6 is negatively correlated with CD8+T cell infiltration level in HNSCC, HNSCC HPV-positive and HNSCC HPV-negative in TIMER2 database. Each dot represents each sample. (b) The CNV of YKT6 is negatively correlated with the level of CD8+T cell in HNSCC, HNSCC HPV-positive and HNSCC HPV-negative databases in TIMER2 database. (c-e) The mRNA expression of YKT6 is negatively correlated with CD8 +T cell infiltration level in GSE30784 and GSE41613 with CIBERSORT, ssGSEA and EPIC algorism. (f) IHC images of high and low protein expression of YKT6 and CD8. Scale bars: 100 μm. The red arrow represents CD8+ T cells infiltrating into the tumours. (g-h) Quantifications of YKT6 and CD8 IHC staining in OSCC tissue microarray chip1 (n = 48) and chip2 (n = 35) show the negative association between YKT6 and CD8. (i-k) In TIMER2-HNSCC, GSE30784 and GSE41613, YKT6 expression is negatively associated with chemokines and chemokine receptors expression. (l-n) The mRNA expression of YKT6 is negatively correlated with immune checkpoint molecules expression level in TIMER2- HNSCC, GSE30784 and GSE41613; ns, not significant, *p < 0.05, **p ≤ 0.01, and ***p ≤ 0.001