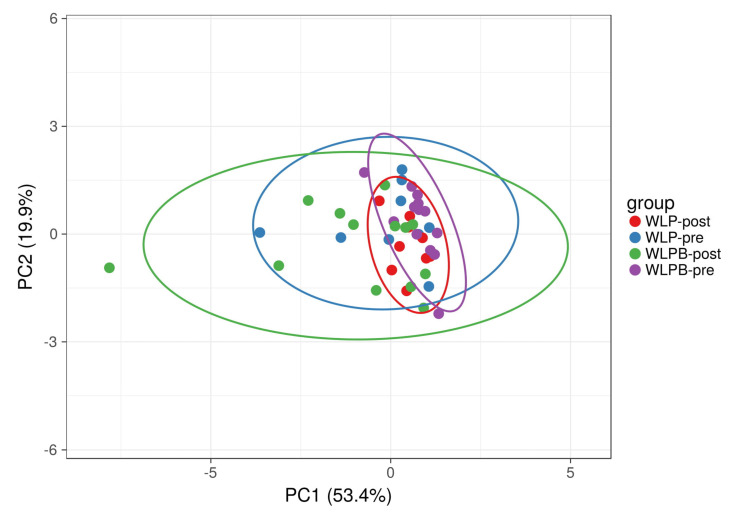
Figure 2.
Beta diversity of analysed samples represented by significantly altered (p < 0.05) bacterial taxa, selected by a Random Forest machine learning analysis, before and after a short-term weight loss program in Bryndza and control groups visualised by PCA. SVD with imputation is used to calculate principal components. The X and Y axis show principal component 1 and principal component 2 that explain 53.4% and 19.9% of the total variance, respectively. Prediction ellipses are such that with a probability of 0.95, a new observation from the same group will fall inside the ellipse (n = 44 data points).

