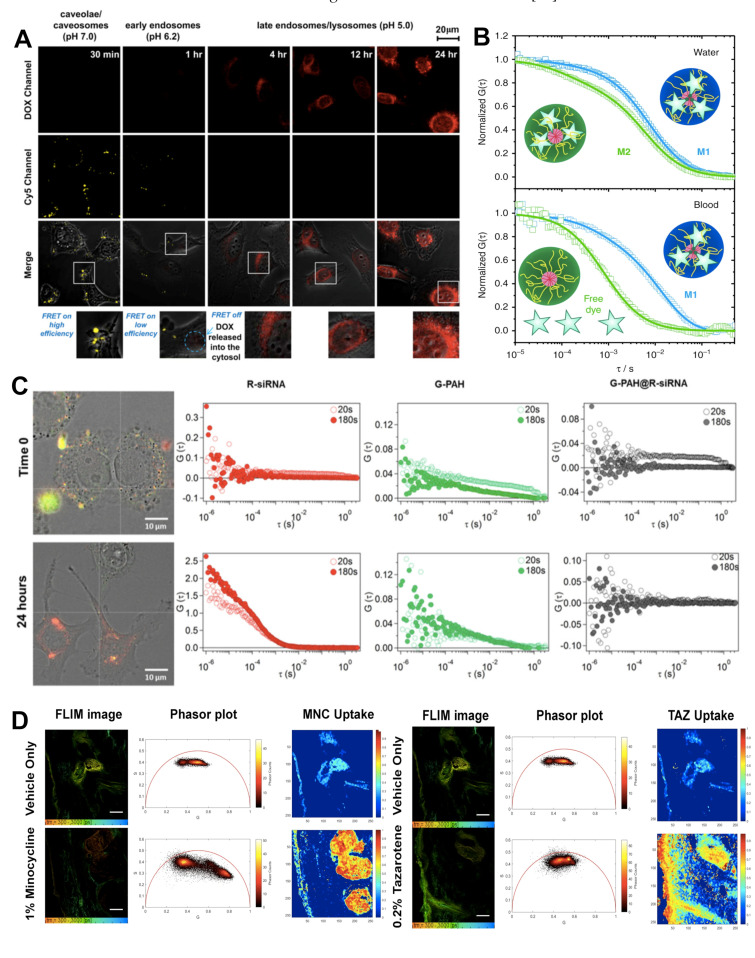
Figure 2.
(A) Dual-emission fluorescence images of HT1080 cells; cells were incubated with DOX-loaded Cy5–NPCS nanoparticles for distinct durations and fluorescence images were then taken by CLSM in optical windows between 560 and 600 nm (DOX imaging channel) and 660 and 700 nm (Cy5 imaging channel) when irradiating NC suspensions at 488 nm. Reproduced with permission from [58]. Copyright 2011 Elsevier. (B) NIR-FCS studies of the loading stability of core-crosslinked micelle nanocarriers in blood. Normalized autocorrelation curves (symbols) and the corresponding fits (lines) are shown for core-crosslinked micelles that were either covalently (M1, blue colour) or noncovalently (M2, green colour) loaded with IRDye®800CW. Measurements in water (upper panel). The dye is mainly loaded to the core-crosslinked micelles and only a small fraction of free dye was detected for both systems. Measurements in the blood flow (velocity of 50 μL h−1) upon incubation with blood for 30 h (at 4 °C) (lower panel). The dye is fully released from M2, but still loaded to M1. Reproduced with permission from [75]. Copyright 2018 Springer Nature. (C) Representative cross-correlation experiment in live cells. A549 cells were imaged in transmission mode and cross-correlation was measured at specific locations inside the cell (white cross). Cells were incubated with the nanoparticles (N/P = 2) in RPMI complete medium. The cells were imaged just after incubation with the nanoparticles (Time 0), and after incubation for a further 24 h in complete medium under controlled conditions (37 °C and 5% CO2). The autocorrelation function in the red channel (ACF_R λex = 633 nm, red markers) is associated with R-siRNA, and the autocorrelation function in the green channel (ACF_G λex = 488 nm, green markers) is associated with G-PAH. The cross-correlation curve is represented by black markers (FCCS) and is associated with PAH/siRNA nanoparticles. Each location was measured in 20 runs of 10 s each. Average curves are reported after 20 s (runs 1–2) and 180 s (runs 3–20). (For interpretation of the references to colour in this figure legend, the reader is referred to the web version of this article.) Reproduced with permission from [29]. Copyright 2019 Elsevier. (D) Quantitative visualization of individual API uptake (MNC or TAZ) in the single component topical drug using the non-Euclidean phasor analysis algorithm. TSCPC-FLIM images of the ex vivo facial skin samples treated with BPX-05 containing no APIs (vehicle), and either 1% MNC or 0.2% TAZ were obtained from 500–550 nm with 780 nm two-photon excitation and 90 s acquisition time. The MNC (left panel) or TAZ (right panel) uptake images were computed using the non-Euclidean phasor analysis algorithm with two fluorescence references, including one endogenous (skin’s autofluorescence) and one exogenous (MNC or TAZ dried form, respectively). The scale bar is 100 μm. Reproduced with permission from [92]. Copyright 2020 Springer Nature.

