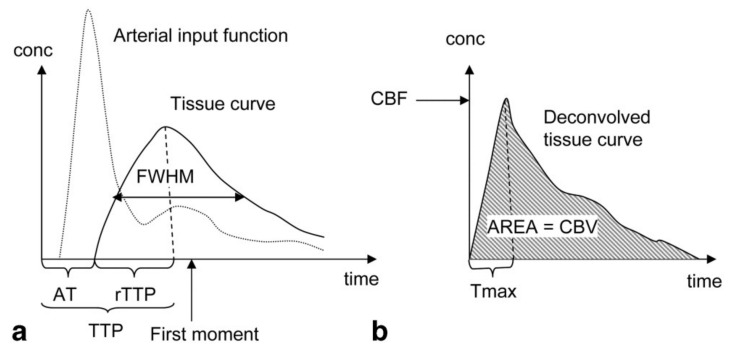
Figure 2.
Parameters derivation in Dynamic Susceptibility Contrast Enhanced (DSC) MRI: (a) Semi-quantitative interpretation can be derived from the signal intensity curve. The Arrival Time (AT) of the bolus can be determined from the time interval between the injection of the contrast agent and the time point where the contrast agent is first detected in the tissue. The Time-To-Peak (TTP) is determined by the time interval between the injection of the contrast agent and the peak of the contrast agent in the tissue. The Full Width at Half Maximum (FWHM) is dependent on the Mean Transit Time (MTT) of the tissue. (b) the contrast concentration curve can be calculated by deconvolution of the Arterial Input Function (AIF) and the signal intensity curve. The Cerebral Blood Flow (CBF) is determined by the maximum height of the contrast concentration curve (Tmax). The Cerebral Blood Volume (CBV) is determined by the area under the contrast concentration curve, while the MTT can be calculated using MTT = CBV/CBF. Reproduced with permission from Leif Østergaard, Journal of Magnetic Resonance Imaging, published by John Wiley and Sons, 2005 [68].

