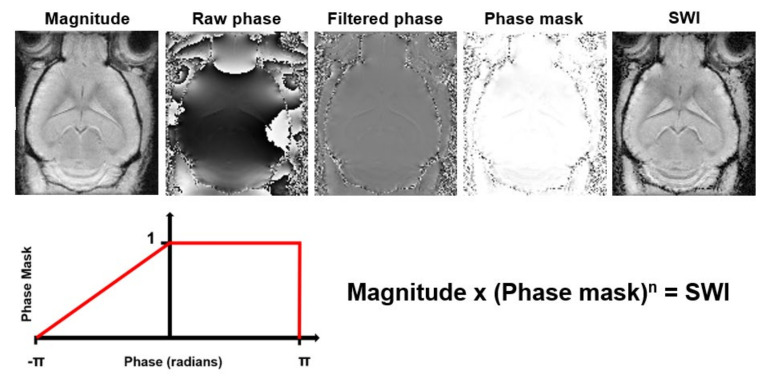
Figure 7.
Processing steps to generate Susceptibility Weighted Images (SWI) from magnitude and phase data. The raw phase data are filtered to remove low frequency fluctuations. Then, a phase mask that scales the filtered phase images to a range from 0 to 1 is created. This phase mask is then multiplied several times (n) with the magnitude image to generate the SWI with enhanced contrast.

