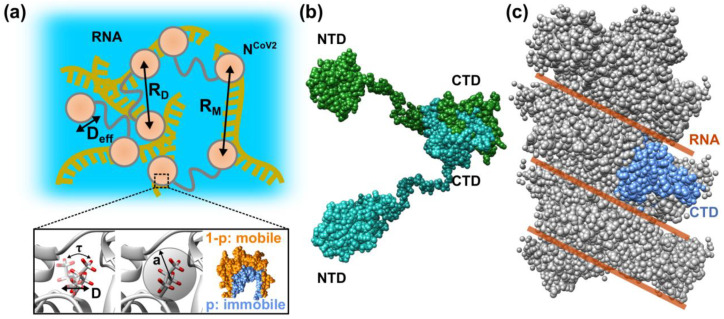
Figure 7.
NCoV2 in different structural states. (a) Schematic illustration of structural and dynamical information on NCoV2 droplets that would be obtained by the methods described in Figure 6. RD and RM show the distance between the NTD and CTD, and the distance between domains of different NCoV2 molecules, respectively. Deff denotes the efficient diffusion coefficient of the NTDs/CTDs and/or of the NCoV2 molecules. In the lower panel, τ, D, and a denote the residence time, the diffusion coefficient, and the amplitude of amino acid side chains and/or backbones, respectively. Hydrogen atoms are shown in red. p and (1-p) show the immobile and mobile fractions of atoms in proteins; (b) NCoV2 in an isolated state (dimer). Each monomer is shown in sea green and forest green, respectively. The central linker was modelled using the Ranch program [93]; (c) a model of nucleocapsid complex for SARS-CoV [8]. Only CTDs are displayed because NTD positions are unknown. Possible locations of RNA molecules are depicted by brown line. One CTD monomer is shown in marine blue The models in sphere or ribbon representation are depicted using UCSF Chimera [16].

