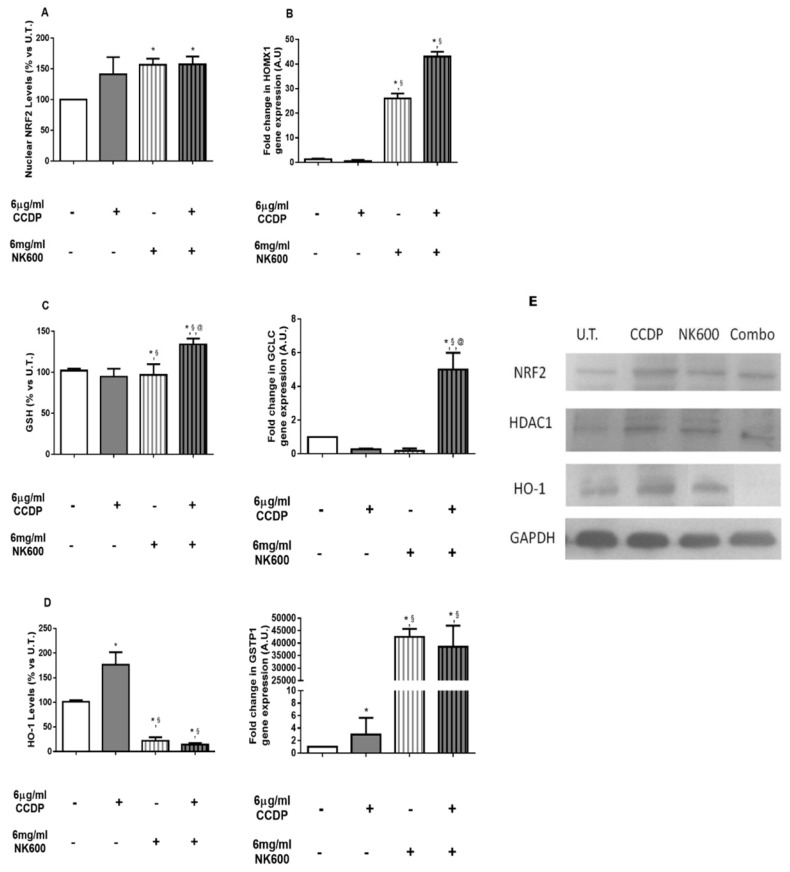
Figure 4.
Antioxidant response analysis. (A) Nuclear levels of NRF2 protein were evaluated in DLD1 after 6 h of 6 µg/mL of CCDP, 6 mg/mL of NK600, and Combo 6 exposure. The analysis was performed by immunoblotting and the bars are expressed as % vs. untreated (U.T.) DLD1 cultures. (B) Gene expression analysis was performed on DLD1 after 12 h of 6 µg/mL of CCDP, 6 mg/mL of NK600, and Combo 6 exposure.HOMOX1, GCLC, and GSTP1 data are expressed as fold-increases relative to untreated cultures at the same end-point, and they are normalized to GAPDH housekeeping gene expression. (C) GSH levels in DLD1 after 24 h of 6 µg/mL of CCDP, 6 mg/mL of NK600, and Combo 6 exposure. The cellular GSH concentration was determined by fluorimetric analysis and is expressed as % vs. U.T. cells. (D) HO-1 protein levels were evaluated in DLD1 after 48 h of 6 µg/mL of CCDP, 6 mg/mL of NK600, and Combo 6 exposure. The analysis was performed by immunoblotting and the bars are expressed as % vs. untreated (U.T.) DLD1 cultures. (E) The figures depicted are representative of at least three similar immunoblot analyses: NRF2 and HO-1 protein levels in untreated DLD1, and in treated DLD1 (6 µg/mL of CCDP, 6 mg/mL of NK600, and Combo 6). HDAC1 and GAPDH were used as internal controls for equal protein loading on gels. The data represent the mean ± standard deviation (SD) of 3 independent experiments. * treated DLD1 vs. U.T. DLD1; §CCDP vs. NK600/Combo6; @NK600 vs. CCDP/Combo 6. * p < 0.01; § p < 0.01; @ p < 0.01 (two-way ANOVA followed by Bonferroni’s test).

