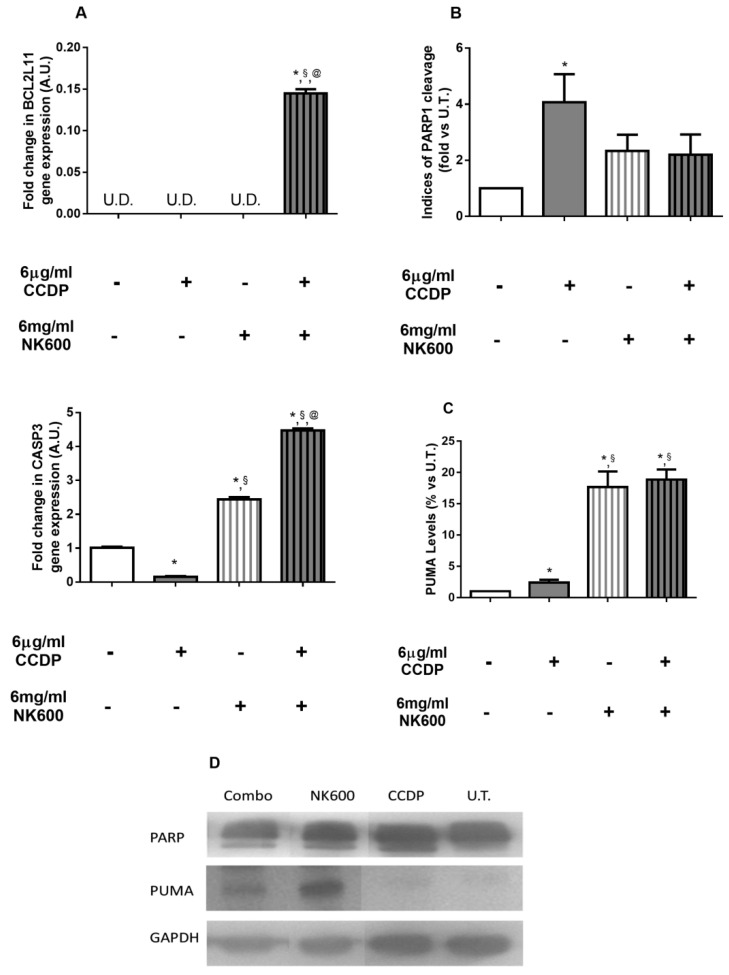
Figure 6.
Apoptosis analysis. (A) Gene expression analysis was performed on DLD1 after 12 h of 6 µg/mLof CCDP, 6 mg/mLof NK600, and Combo 6 exposure.BCL2L11 and CASP3. Data are expressed as fold-increases relative to untreated cultures at the same end-point and are normalized to the GAPDH housekeeping gene expression. (B,C) Immunoblotting analysis. Bars represent the ratio of cleaved PARP(B) and Puma protein levels (C), and the data are expressed as fold values vs. U.T. DLD1 cells. (D) The figures depicted are representative of at least three similar immunoblot analyses of PARP and PUMA protein levels in untreated DLD1, and in treated DLD1 (6 µg/mL of CCDP, 6 mg/mLof NK600, and Combo 6). GAPDH was used as an internal control for equal protein loading on gel. The data represent the mean ± standard deviation (SD) of 3 independent experiments. * treated DLD1 vs. U.T. DLD1; §CCDP vs. NK600/Combo6; @NK600 vs. CCDP/Combo 6. * p < 0.01; § p < 0.01; @ p< 0.01 (two-way ANOVA followed by Bonferroni’s test).

