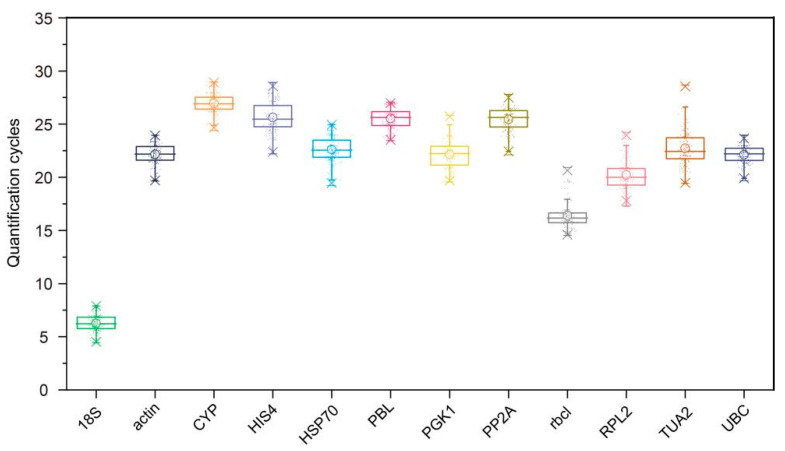
Figure 1.
Quantification cycle values of 12 candidate reference genes in 159 samples. The boxes indicate the 25th and 75th percentiles, with the lines in the center of the boxes representing the medians. The whiskers and asterisks represent the 99% confidence intervals and outliers, respectively. The upper and lower horizontal lines indicate the maximum and minimum values, respectively, and the small circles represent the average values.

