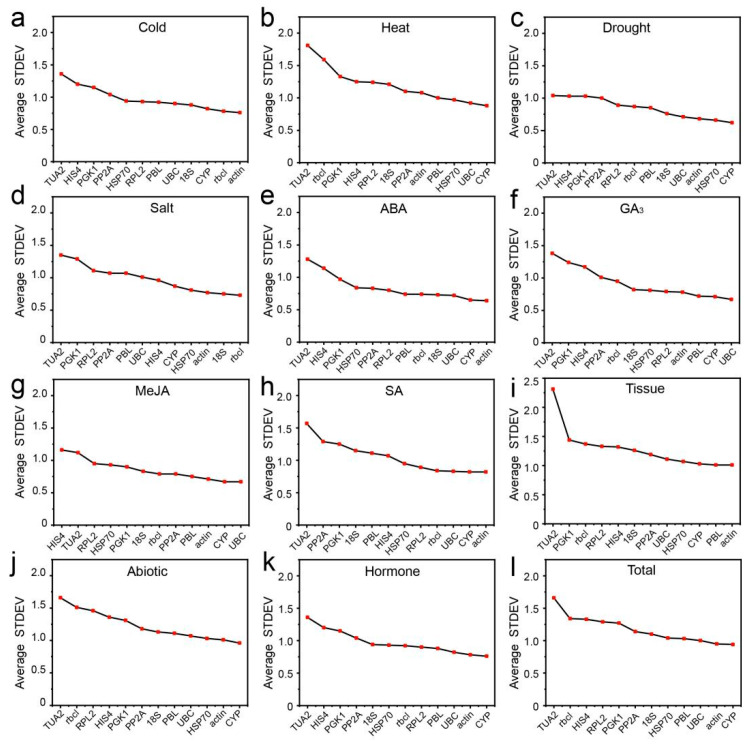
Figure 2.
Average standard deviation (STDEV) indicated by delta Ct analysis. (a) 4 °C cold stress; (b) 42 °C heat stress; (c) drought stress simulated by 15% PEG-6000 treatment; (d) salt stress stimulated by 200 mM NaCl treatment; (e) 200 μM ABA treatment; (f) 200 μM GA3 treatment; (g) 200 μM MeJA treatment; (h) 200 μM SA treatment; (i) in different tissues (stems, tender needles, needles, cones, and seeds); (j) under abiotic stress; (k) under hormone treatments; and (l) in total samples.

