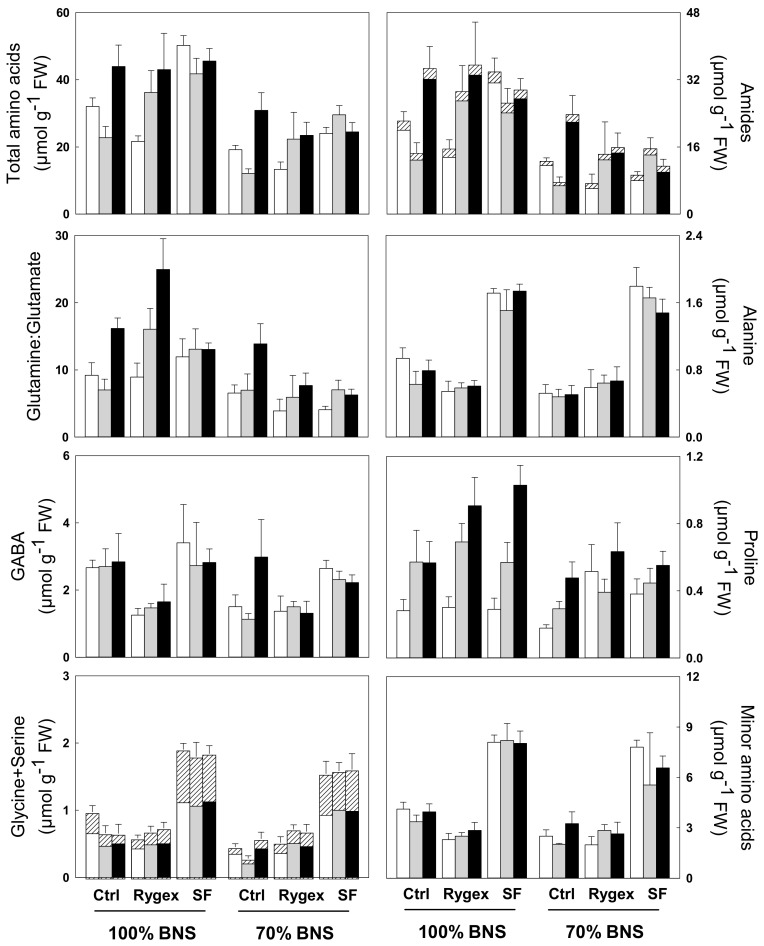
Figure 2.
Leaf content of total amino acids, amides (the black and white fine pattern in the bar represents only asparagine), glutamine:glutamate, alanine, GABA, proline, glycine + serine (the black and white fine pattern in the bar represents only glycine), minor amino acids. Bar colors and experimental design are as in Figure 1. The values are mean ± S.D. (n = 5)). Significance of the main factors (nutrient solution, biostimulant and salinity) and their interactions are shown in Table 4 and Table 5.

