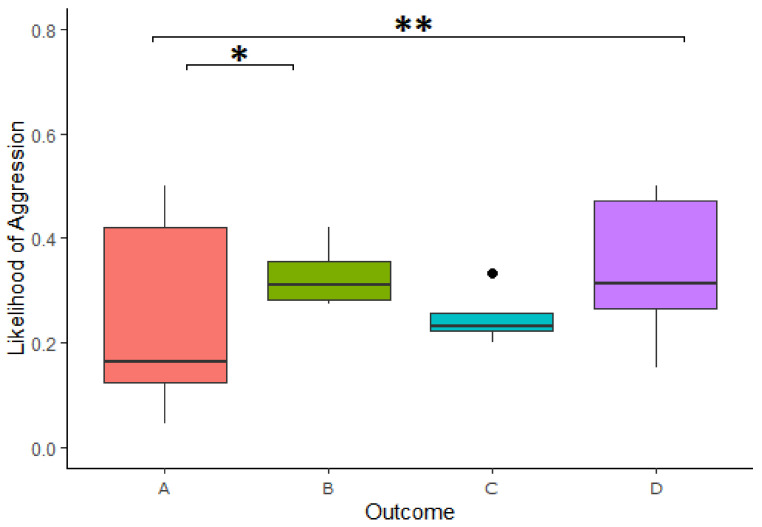
Figure 6.
Likelihood of aggressive behaviors across outcomes. A = reward equivalent to that of other, B = reward smaller than that of other, C = reward larger than that of other, D = no reward due to theft. Boxplots show the median (solid line), 25th-75th percentile (box) and the largest and smallest value (whiskers). Dots reflects outliers. * indicates a difference at the p < 0.05 level and ** indicates a difference at the p < 0.01 level.

