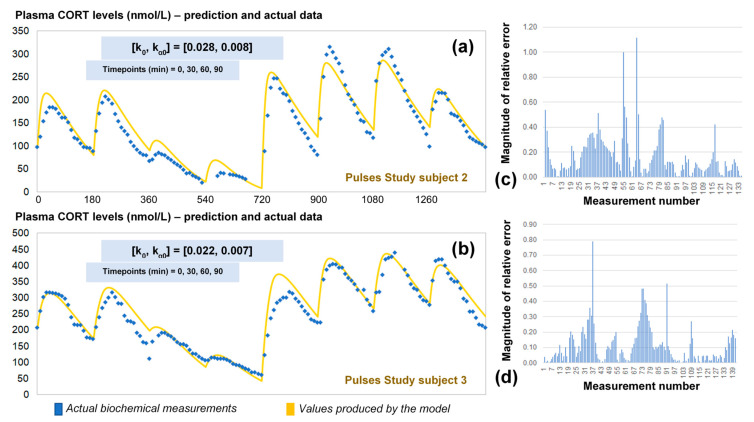
Figure 5.
(a) Comparison of the revised model predictions (yellow line) with the ultradian rhythm of plasma cortisol observed in subject 2 (blue dots) from the Pulses study following subcutaneous pulsatile CORT infusion (see Materials and Methods). (b) Comparison of the revised model predictions (yellow line) with the ultradian rhythm of plasma cortisol observed in subjects 3 (blue dots) from the Pulses study following subcutaneous pulsatile CORT infusion (see Materials and Methods). The revised model assumes discretely varying absorption and clearance rates and the brut-force search method calculates the initial pair of (k0, kα0) rates by four cortisol measurements (for instance at timepoints 0, 30 60 and 90 min). We also estimated the relative error of the model predictions across all plasma cortisol data points for subject 2 (c) and 3 (d). The periodicity of the data allows us to assume that the value of cortisol 24 h later is the same as the first value given, and hence, the error is reduced as we approach the end of that 24-h period. CORT: cortisol, k: clearance rate, kα: absorption rate. Time points of delivery (magnitude of doses): 0 min (2.3 mg/230 μL), 180 min (2.3 mg/230 μL), 360 min (0.5 mg/50 μL), 540 min (0.5 mg/50 μL), 720 min (4 mg/400 μL), 900 min (4 mg/400 μL), 1080 min (4 mg/400 μL), 1260 min (2.3 mg/230 μL).

