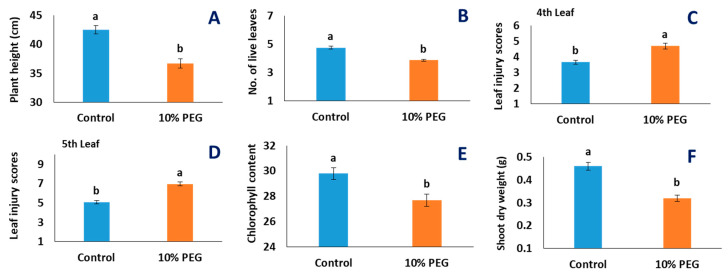
Figure 3.
Effects of PEG-induced osmotic stress on morphological traits of shoot of 22 wheat genotypes. Each data bar represents the average of 3 replicates from 22 genotypes: (A) plant height (cm); (B) total number of live leaves; (C) leaf injury scores for the fourth leaf; (D) leaf injury scores for the fifth leaf; (E) chlorophyll content; (F) shoot dry weight in g. The statistical significance was tested following a general linear model and a post hoc analysis was conducted following Tukey’s pairwise comparison. Letters ‘a’ and ‘b’ denote significant differences. Vertical bars indicate standard error of means.

