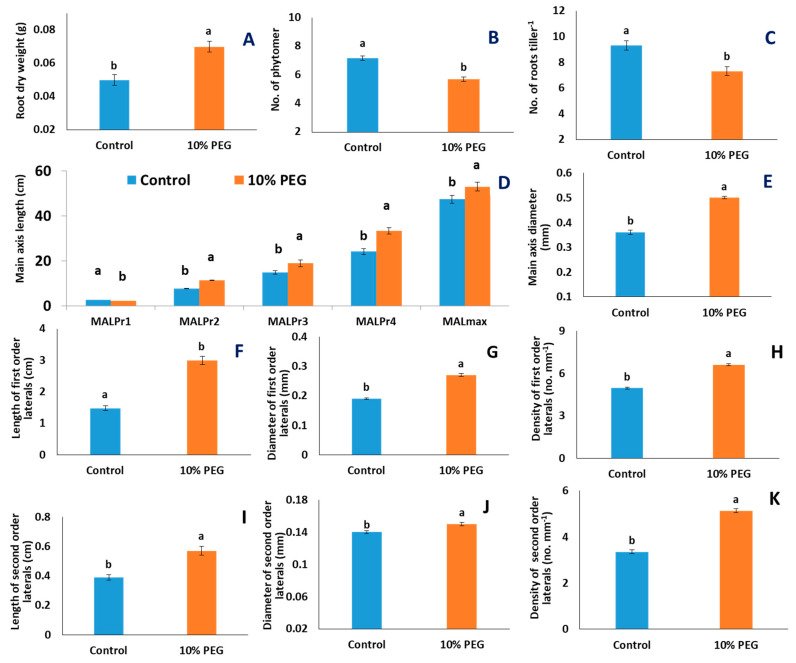
Figure 4.
Effects of PEG-induced osmotic stress on morphological traits of roots of 22 wheat genotypes. Each data bar in A, B–E, and F–L represents the average of 3, 2, and 10 replicates from 22 genotypes, respectively: (A) root dry weight (g); (B) number of root-bearing phytomers per tiller; (C) number of roots per tiller; (D) main axis length (MAL) at the root-bearing phytomer (Pr1–4) and maximum main axis length (MALmax); (E) main axis diameter; (F–H) length (cm), diameter (mm), and density (no. mm−1) of first-order lateral roots; (I–K) length (cm), diameter (mm), and density of second-order lateral roots (no. mm−1). The statistical significance was tested following a general linear model and a post hoc analysis was conducted following Tukey’s pairwise comparison. Letters ‘a’ and ‘b’ denote significant differences. Vertical bars indicate standard error of means.

