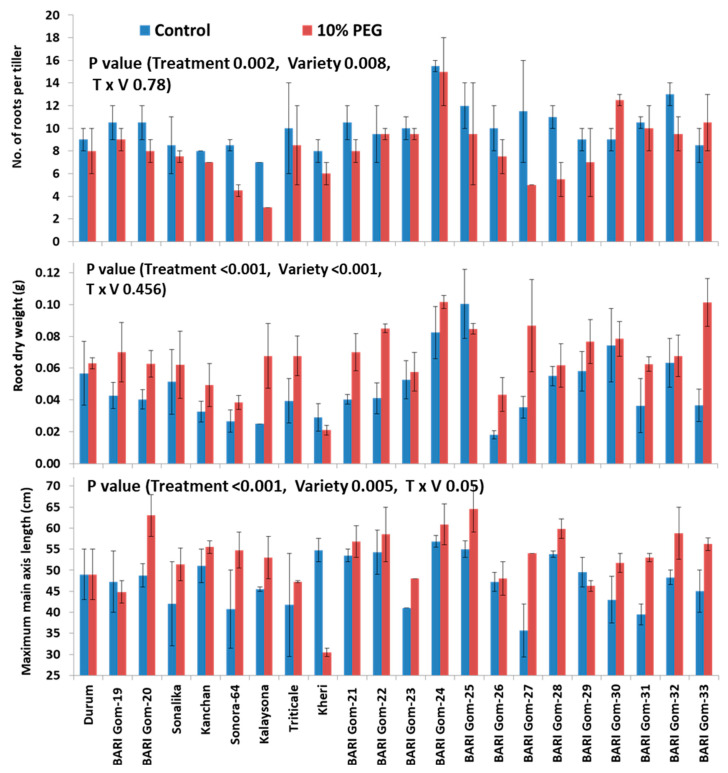
Figure 5.
Effects of PEG-induced osmotic stress on selected root traits of wheat genotypes. Each data bar represents average of three replicates for root dry weight and that of two replicates for number of roots per tiller and maximum main axis length. Vertical bars represent standard error of mean. The statistical significance was tested following a two-way ANOVA under a general linear model procedure.

