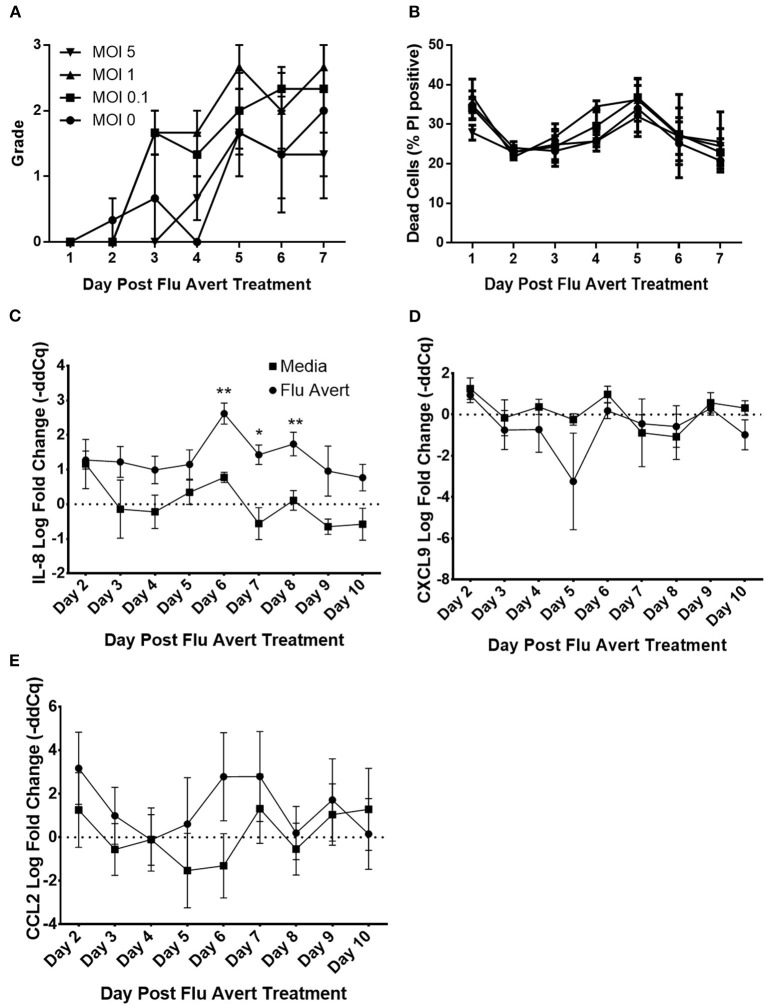
Figure 1.
Cell viability and chemokine mRNA expression following Flu Avert treatment in ERECs. (A) Microscopic analysis of EREC cultures. Mean grades from cells ± SEM of three horses following Flu Avert treatment at different MOIs. Grading of cell viability from 0 to 3 is described in Table 1. (B) Cell viability analysis. Mean percent positive cells ± SEM of three horses at each MOI as determined with propidium iodide staining. Black circle is MOI = 0. Black square is MOI = 0.1. Black upright triangle is MOI = 1. Black upside-down triangle is MOI = 5. (C) IL-8 mRNA expression. (D) CXCL9 mRNAs expression. (E) CCL2 mRNA expression. Values are mean log fold change (–ddCq) ± SEM. Black square represents untreated (media) treated ERECs. Black circle represents Flu Avert-treated ERECs. *p ≤ 0.05 and **p < 0.01, respectively, between the media and Flu Avert treatment groups.

