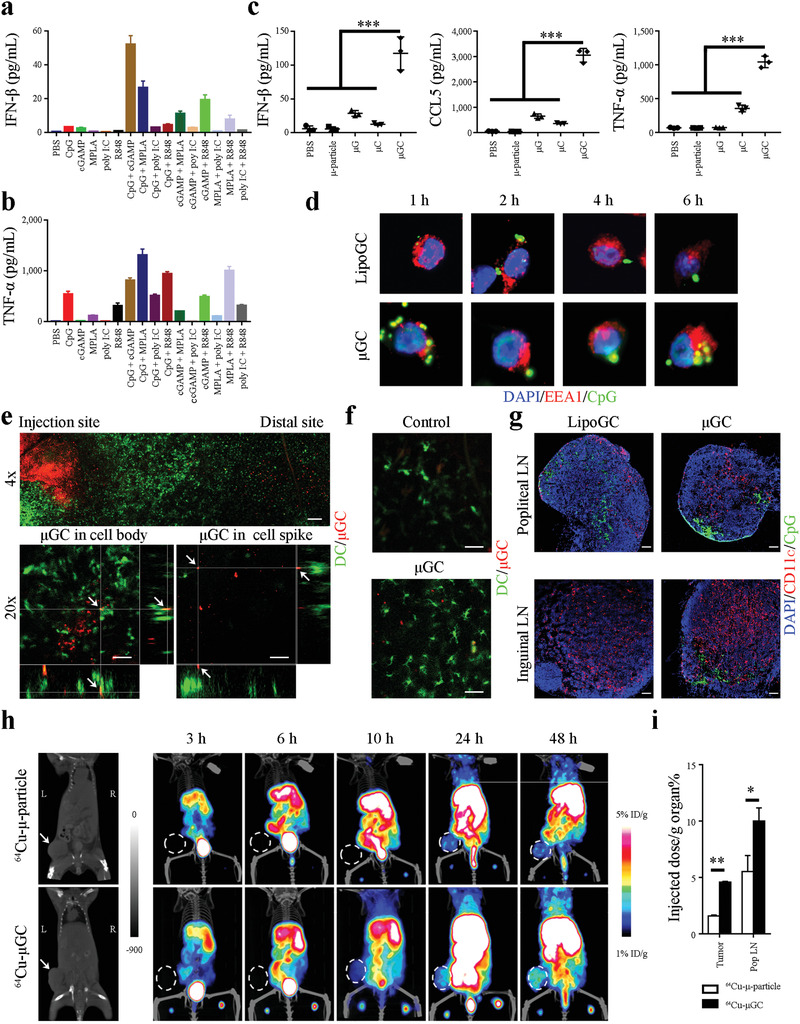
Figure 1.

DC activation by adjuvants in vitro and in vivo. a,b) Activation of IFN‐β and TNF‐α expression in BMDC by soluble TLR ligands and a STING agonist. BMDCs were treated with a TLR ligand, a STING agonist, or their combination for 24 h, and enzyme‐linked immunosorbent assay (ELISA) was applied to measure a) IFN‐β and b) TNF‐α levels in cell growth media. Samples were triplicated. Error bars: mean +/− SD ***: p < 0.001. c) Synergistic activation of cytokine expression in BMDCs treated with μGC particles. The μ‐particles loaded with liposomal cGAMP (μG), CpG (μC), or cGAMP and CpG combination (μGC) were applied to treat BMDCs, and levels of IFN‐β, CCL‐5, and TNF‐α in cell growth media were determined with ELISA 24 h after treatment. Samples were triplicated. Error bars: mean +/− SD. d) Confocal microscopic analysis on time‐dependent subcellular localization of LipoGC and μGC in dendritic cells. DC2.4 cells were treated with FITC‐labeled LipoGC or μGC (in green) for up to 6 h and stained with DAPI for nuclei (in blue) and an anti‐EEA1 antibody for early endosomes (in red). e) Intravital microscopic image of EYFP‐expressing DCs (in green) adjacent to the site of μGC (in red) injection. Upper panel: Overview of image. Bottom panel: Z‐stack imaging of focused areas displaying μGC particles (in red, pointed with white arrows) inside the cell body (left) or in the spike (right) of DCs (in green). f) Morphology of DCs adjacent to the injection site in mice treated with control PBS or μGC. g) Microscopic analysis of LipoGC and μGC in lymph nodes. Mice with primary TUBO tumors were inoculated with FITC‐labeled LipoGC or μGC in the foot pads, and popliteal and inguinal lymph nodes were collected 24 h later. Frozen sections of lymph nodes were stained with DAPI (in blue) and anti‐CD11c antibody (in red). Bar: 100 µm. h) PET‐CT tracking of particle transport in mice with primary TUBO tumors. Mice were inoculated with 64Cu‐labeled μ‐particles or μGC in the foot pads, and time‐dependent particle transport was monitored with PET‐CT imaging in the next 48 h. Primary tumors were pointed with arrows in the left panel and circled in rest panels. Representative graphs are shown. n = 3 mice per group. i) Quantitative analysis of radiation activities in tumor and popliteal lymph nodes (Pop LN) was measured and compared. Statistics: ANOVA for multi‐group comparison and Student's t‐test for comparison between two groups. n = 3 mice per group. Error bars, mean +/− SD. *: p < 0.05; **: p < 0.01.
