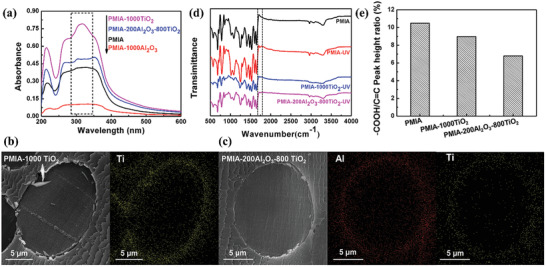
Figure 4.

a) Solid ultraviolet absorption spectrum of the bare PMIA and the ALD‐coated PMIA; b,c) SEM images of a ruptured cross‐section sample and the corresponding mapping of bare PMIA and the ALD‐coated PMIA, respectively; d) FTIR spectrum of PMIA before UV radiation, and PMIA, PMIA–1000TiO2, and PMIA–200Al2O3–800TiO2 after UV radiation for 90 min. e) —COOH/C=C peak height ratio of PMIA, PMIA–1000TiO2, and PMIA–200Al2O3–800TiO2 after UV radiation for 90 min by using normalized treatment based on the characteristic peak of 1610 cm−1, respectively.
