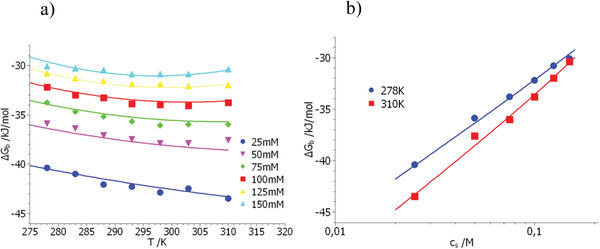
Figure 2.

Comparison of the free energy of binding obtained for the system dPGS/lysozyme[ 38 ] with theory (Equation (21)). (a) Displays the measured free energies ΔG b as the function of temperature. Parameter is the concentration of salt indicated in the graph. (b) Displays the free energies measured at 310 K as the function of salt concentration. The solid lines mark the fit by Equation (21) using the parameters in Table 1.
