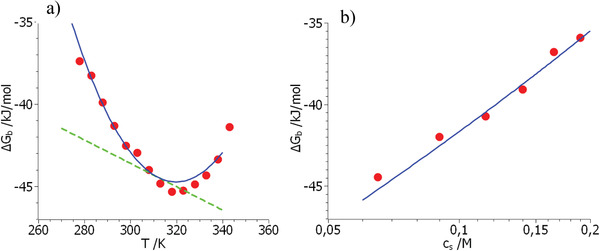
Figure 3.

Comparison of the experimental data of ΔG b (red points) obtained for the system Klentaq/DNA[ 7 , 8 ] with Equation (21). (a) Displays the dependence on temperature whereas (b) gives the respective comparison as the function of salt concentration measured at 298 K. The solid lines mark the fit by Equation (21) using the parameters gathered in Table 1. The dashed line in (a) shows the terms RTΔn cilnc s + ΔH 0 − TΔS 0 (see Equations (21) and (23)).
