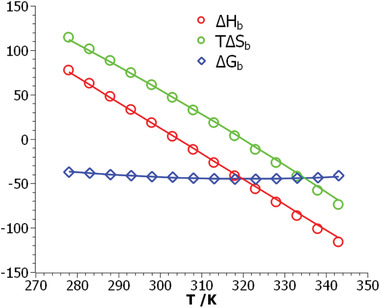
Figure 4.

Comparison of thermodynamic data obtained for the system Klentaq/DNA.[ 7 , 8 ] The red circles display the binding enthalpies obtained by application of Equation (11) whereas the green circles show the respective entropies multiplied by T. The blue diamonds denote the free energies obtained experimentally from ITC. The solid lines mark the theoretical results: red line: binding enthalpy ΔH b calculated from Equation (16), green line: TΔS b as obtained from Equation (20), and blue line: ΔG b according to Equation (21). See also the discussion of Figure 3.
