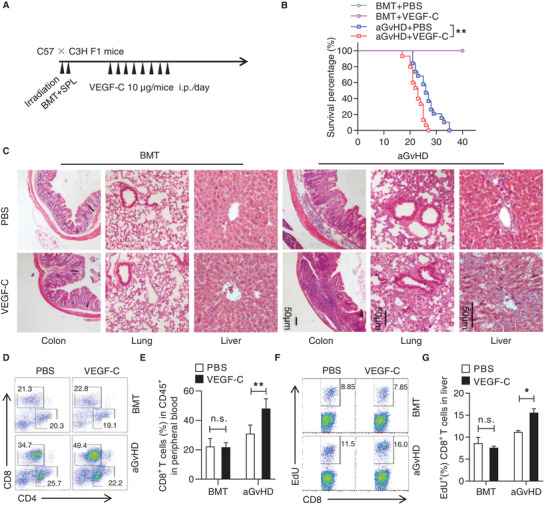
Figure 3.

VEGF‐C exacerbates aGvHD progression. A) Experimental scheme of the establishment of aGvHD model for investigating the effect of VEGF‐C. Lethally irradiated C3H × C57BL/6 F1 mice were adoptively transferred with bone marrow cells (5 × 10⁶) and splenocytes (5 × 10⁷) from C57BL/6 mice to induce aGvHD. On day 7 post aGvHD induction, mice were i.p. injected with VEGF‐C at 10 µg per mouse. For the bone marrow transplantation (BMT) group, recipient mice were adoptively transferred with bone marrow cells (5 × 10⁶), with or without VEGF‐C administration. B) Survival curves of aGvHD mice treated with PBS and VEGF‐C (BMT + PBS: n = 5, BMT + VEGF‐C: n = 5, aGvHD + PBS: n = 19, and aGvHD + VEGF‐C: n = 15). C) Hematoxilin & eosin staining of the liver, lung, and colon of aGvHD mice with PBS or VEGF‐C treatment. Scale bar: 50 µm. D,E) Flow cytometric analysis of the percentages of CD4+ T cells and CD8+ T cells in the peripheral blood of aGvHD mice with PBS or VEGF‐C treatment. F,G) Flow cytometric analysis of EdU incorporation in CD8+ T cells from the liver of aGvHD mice with PBS or VEGF‐C treatment. Data are presented as mean ± SEM. n.s: no significance, * p < 0.05 and ** p < 0.01.
