
Figure 7.
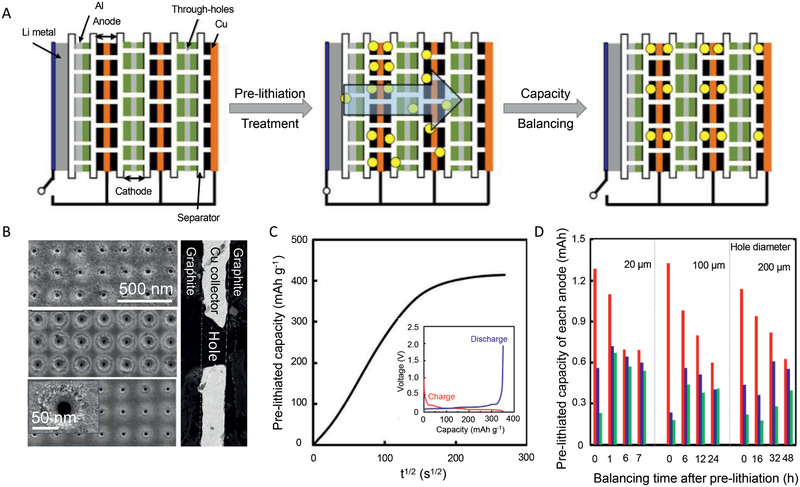
A) The schematic graph of sacrificed electrode method; B) The SEM graphs of electrodes with holes for ion diffusion. C) The relationship between pre‐lithiated capacity to the time (inserted graph is the charge and discharge profiles of pre‐lithiated graphite). D) The relationship between the pre‐lithiation degree on every electrode and balancing time after pre‐lithiation. Reproduced with permission.[ 100 ] Copyright 2019, Elsevier Ltd.