Figure 2.

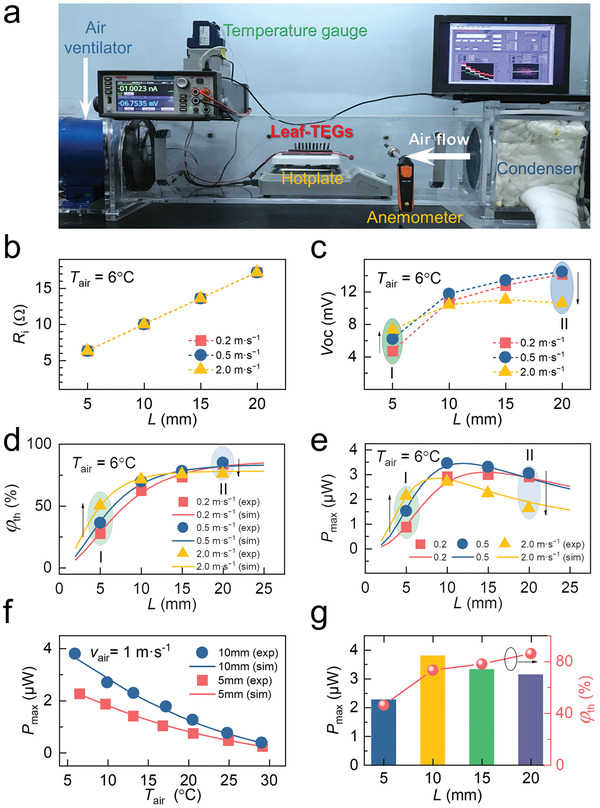
Effects of v air and T air on the output power performance of leaf‐TEG with different dimensions. a) A lab‐made air duct system that can be used to adjust T air and v air. From b) to e), T air is 6 °C. b) Internal resistance R i, c) Open‐circuit voltage V oc, d) temperature difference utilization ratio φ th, and e) maximum output power P max of leaf‐TEG with different length under different air velocity conditions (0.2, 0.5, and 2.0 m s−1). f) Maximum output power varies with the air temperature. g) The maximum P max and the corresponding φ th of leaf‐TEG (L = 5, 10, 15, and 20 mm) in our testing conditions (T air: 6–29 °C, V air: 0.15–2.0 m s−1).
