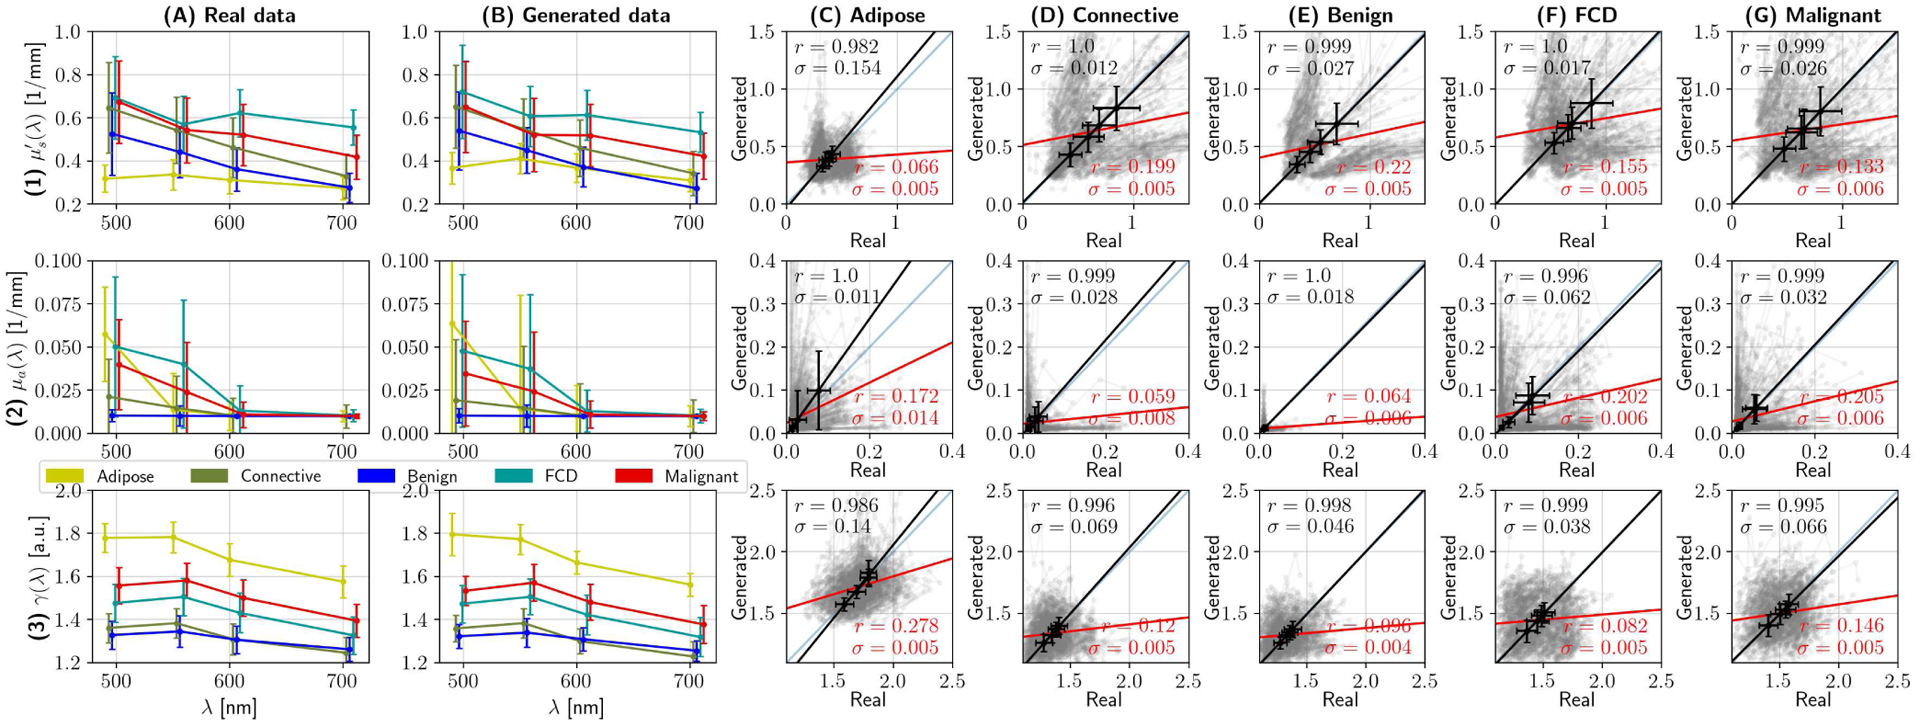
Fig. 10.

Quality assessment of synthesized spectra can be done indirectly, by analyzing optical properties. Rows (1), (2) and (3) show results pertaining to reduced scattering coefficient , absorption coefficient μa, and phase function parameter γ, respectively. Columns (A) and (B) show the median optical properties per tissue category as error-bar plots, where whiskers represent one standard deviation, of real and synthesized spectra, respectively. Columns (C) through (G) randomly compare optical properties of real data with synthesized equivalents for each of the main tissue supercategories. In this grid, each subplot contains 500 pairs of optical properties from real and synthesized spectra in grey, the identity line y = x –plotted in blue–, and two linear regression tests. The red line and stats (namely, coefficient of determination and standard error) are the result of applying linear regression on the raw data, while the black line, errorbars and corresponding statistics correspond to analyzing average optical properties. The former provides little information due to the multimodal characteristics of the dataset; however, the latter demonstrates that, on average, the optical properties of the real and synthesized datasets match.
