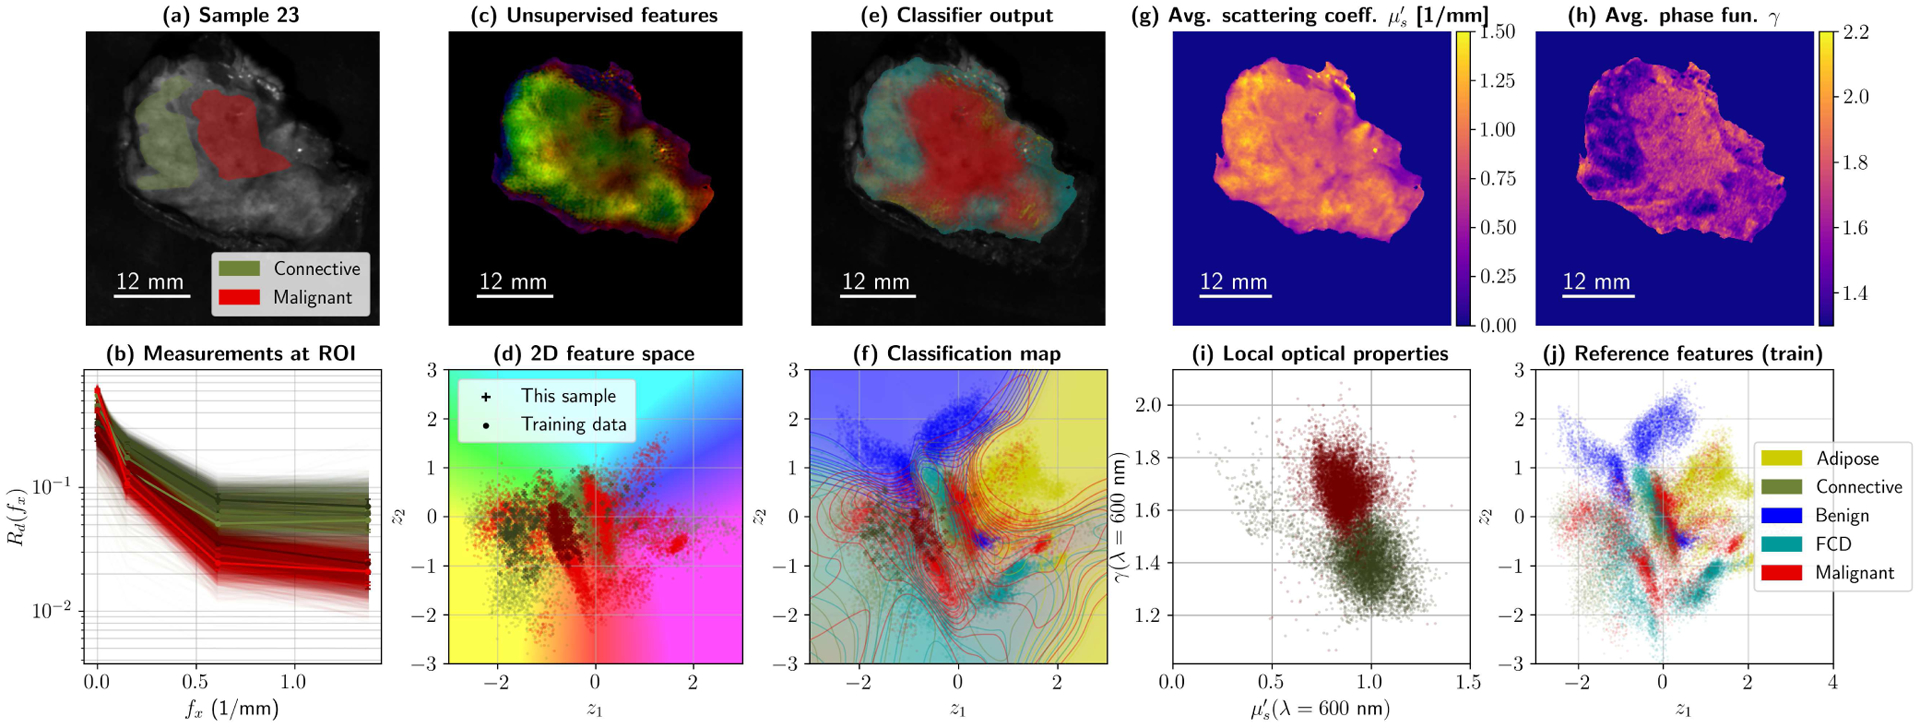
Fig. 11.

Summary for Sample 23 during 5-fold cross-validation (High Grade IDC embedded in connective tissue). Subplot (a) shows ROIs and average reflectance; (b) presents 10% of the reflectance data within those ROIs, at all four wavelengths. Processing the data with the primary and secondary autoencoder produces a map with two values per pixel, which was translated to HSV values to create a false color image (c). The corresponding colors for the false color map are shown with the test spectra from (b) –as well as training data for the categories of interest– in subplot (d). The classifier uses the 256-D pixels from the primary AE to produce a diagnostic map (e). Classification boundaries can also be projected onto 2D (f), by color-coding z-space with the classifier . Finally, optical property maps can be plotted, namely reduced scattering (g) and phase function parameter γ (h). Local differences in OPs can be observed and plotted as usual (i). The complete training set in z-space for this fold is left, for reference, in (j).
