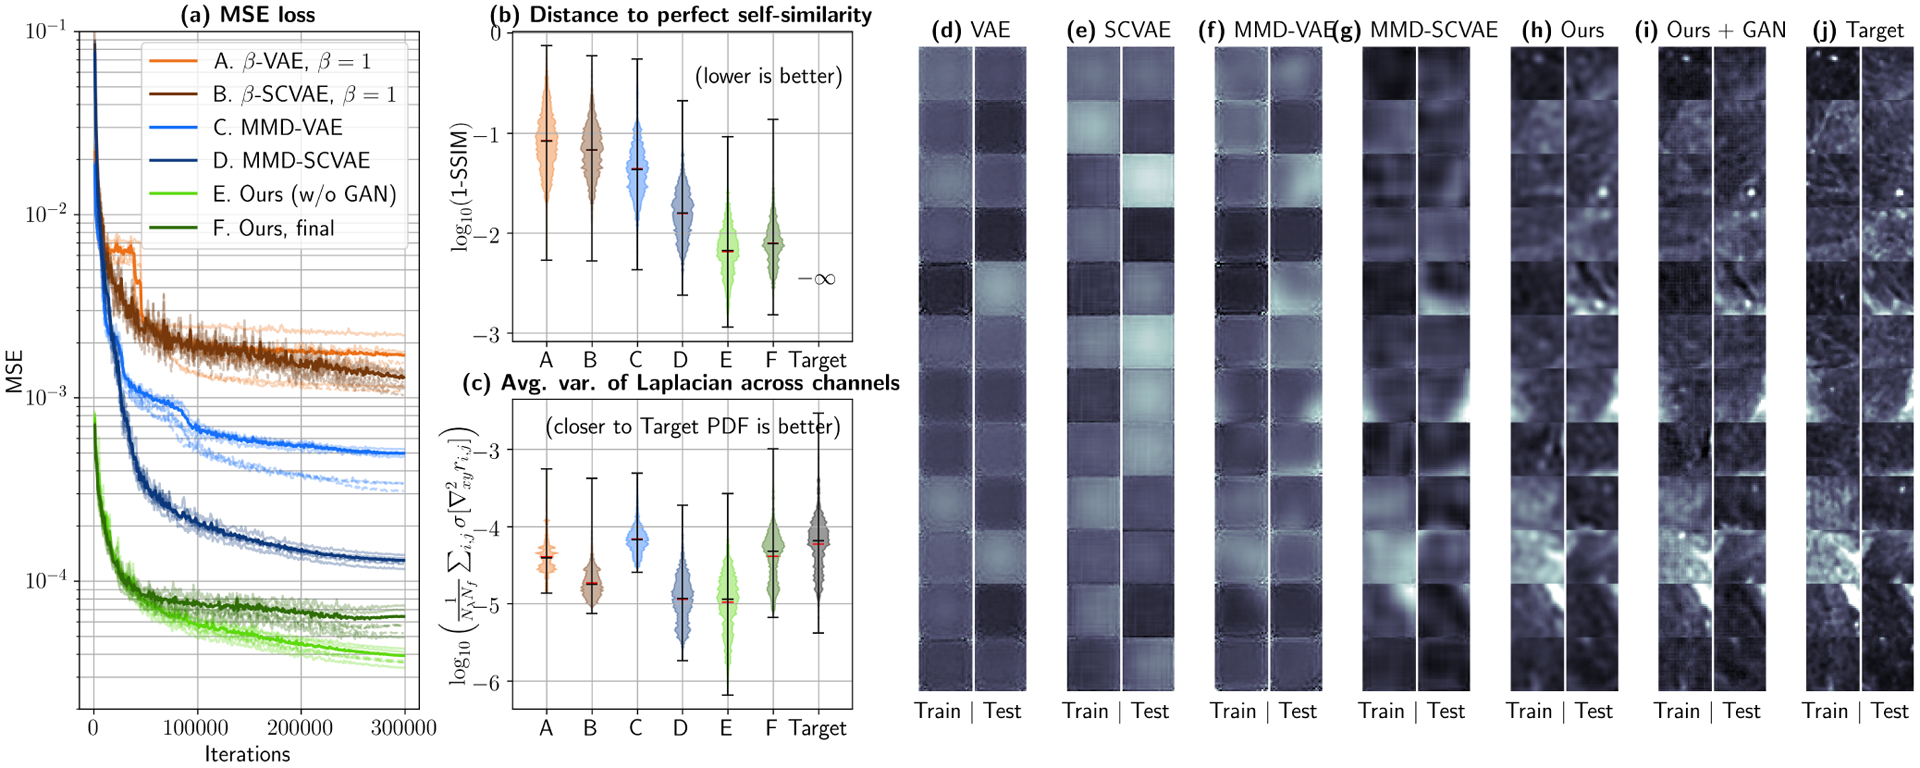
Fig. 5.

Autoencoder comparison via 3-fold cross-validation. (a) Mean Squared Error (MSE) for all the tested architectures. Transparent dashed curves depict training errors, while continuous curves correspond to test errors for each fold. The average test error is shown as a thicker, non-transparent line for each network. Architecture E (MMD-SCVAE with fully connected connections at encoder and decoder, Gradually Upscaling Network and auxiliary fully connected feature maps) achieves the lowest average test MSE in the least amount of iterations. (b) This can also observed by evaluating the distance to a perfect test SSIM (1.0), where architectures E and F show up to an order-of-magnitude improvement in self-similarity when compared to controls. (c) However, most architectures still return blurred reconstructed patches, which can be quantified by the average variance of the Laplacian across channels. By using an auxiliary GAN Discriminator (Architecture F), high frequency components can be better recovered, which translates in a variance histogram that better follows the true distribution. Reconstructions returned by each of the proposed architectures can be qualitatively observed in (d)–(i) and compared with the true data (j). Reflectance values are shown in the range [0.0, 0.04] at spatial frequency fx = 0.61 mm−1 and wavelength λ = 500 nm.
