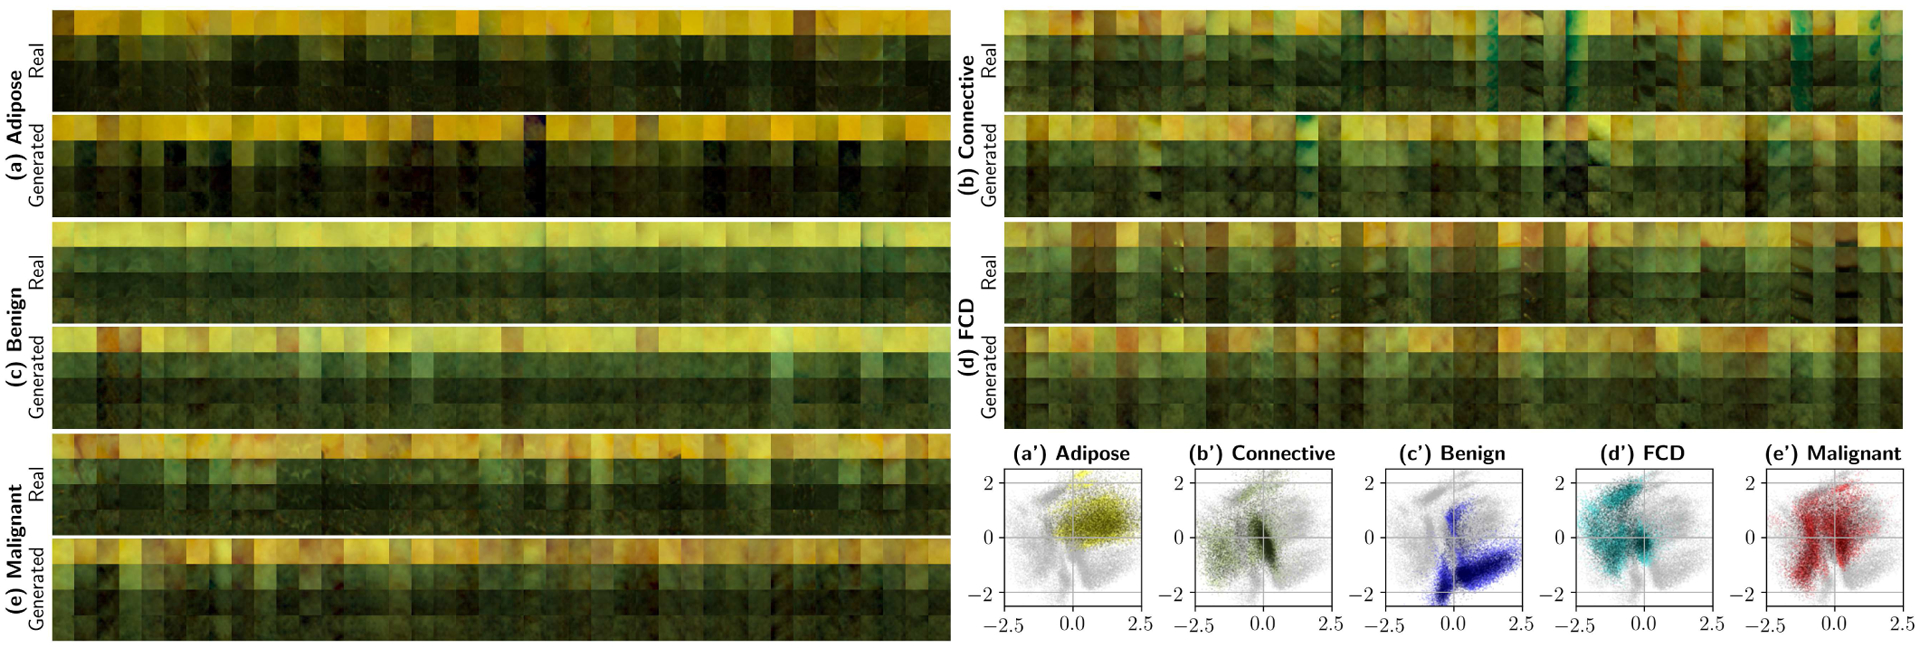
Fig. 8.

Generating patches at various frequencies with the LS-GAN stack. The following are outputs of the primary autoencoder to synthesized 256-dimensional feature keywords. This experiment uses the complete dataset (80% for training, 20% for validation). Plots (a) through (d) show spectra-to-RGB reconstructions of real and generated patches, where each column displays a patch at the four different spatial frequencies (0.0, 0.15, 0.61, and 1.37 mm−1). Subplots (a’) through (e’) show 5000 artificially generated samples for each supercategory projected onto the 2D space of the secondary bottleneck (shown in Fig. 6.(a)). In these scatter plots, light colored points represent reference training data, and darker points correspond to the synthesized data. These 2D projections qualitatively ensure correct sample generation without significant mode collapse. Best viewed in color.
