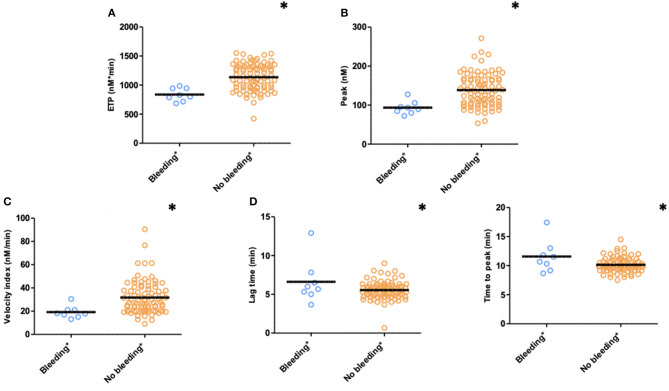
Figure 3.
Thrombin generation (TG) in PPP patients with (n = 15) and without (n = 78) clinically relevant bleeding (N = 93) during follow-up (bleedings recorded at T2 and T3). (A) ETP, (B) Peak, (C) Velocity index, (D) Lag time, and (E) Time to peak. Significant lower ETP levels (p ≤ 0.001), peak height (p = 0.004), and velocity index (p = 0.016) in patients with clinically relevant bleeding during follow-up. Significant longer time to peak (p = 0.007) and lag time (p = 0.036) in patients with clinically relevant bleeding. Means are indicated by lines. *p < 0.05. ETP, Endogenous Thrombin Potential; PPP, Platelet Poor Plasma; N, number of patients.

