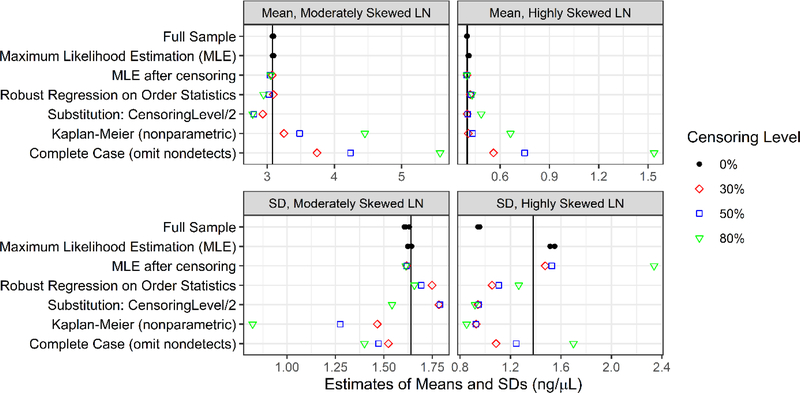
Figure 2.
Bias in estimates of the mean and SD from the simulation study for the moderately and highly skewed lognormal (LN) distributions is the difference of their estimated values (shown here for n=50) and true values, which are indicated by the reference lines. For the moderately skewed lognormal, the true mean is 3.08, and the true SD is 1.64. For the highly skewed lognormal, the true mean is 0.40, and the true SD is 1.38.

