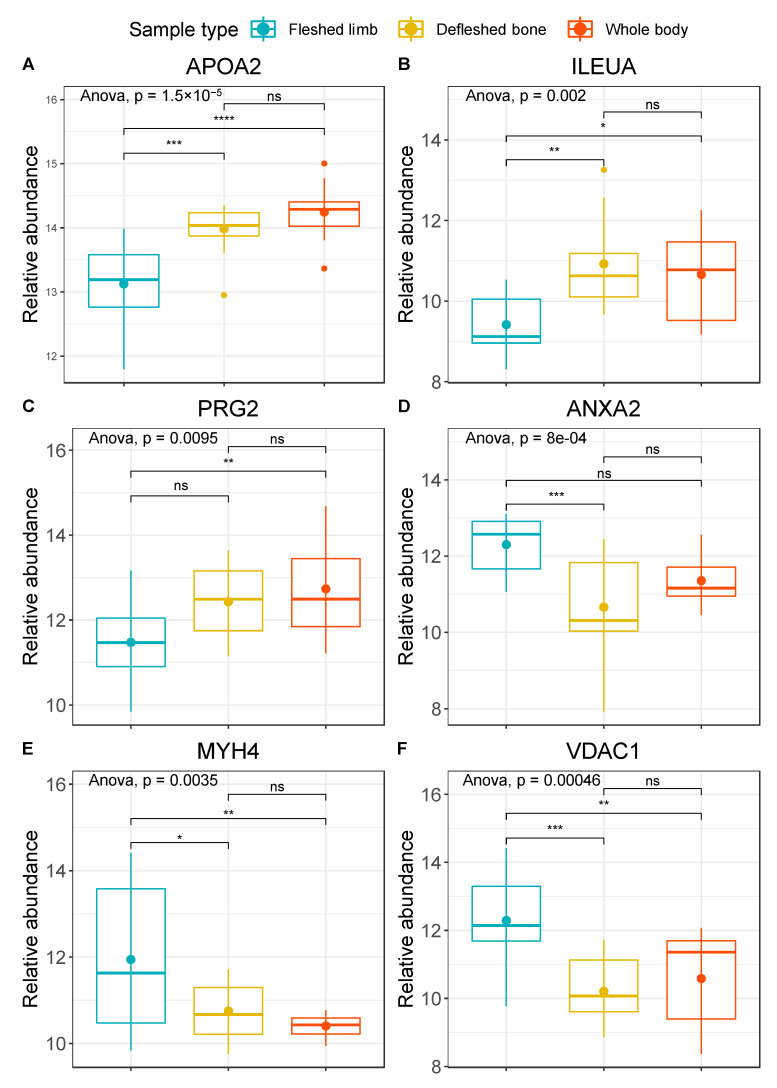
Figure 3.
Boxplots with the relative abundances (arcsinh normalised) of (A) APOA2, (B) ILEUA, (C) PRG2, (D) ANXA2, (E) MYH4, and (F) VDAC1. Fleshed exposed limbs are represented in blue, defleshed buried bones in yellow, and exposed whole bodies in red. The plots provide extended p values for multivariate ANOVA and coded significance for Tukey’s HSD test (p < 0.0001 ‘****’; p < 0.001 ‘***’, p < 0.01 ‘**’, p < 0.05 ‘*’; p > 0.05 ‘ns’).

