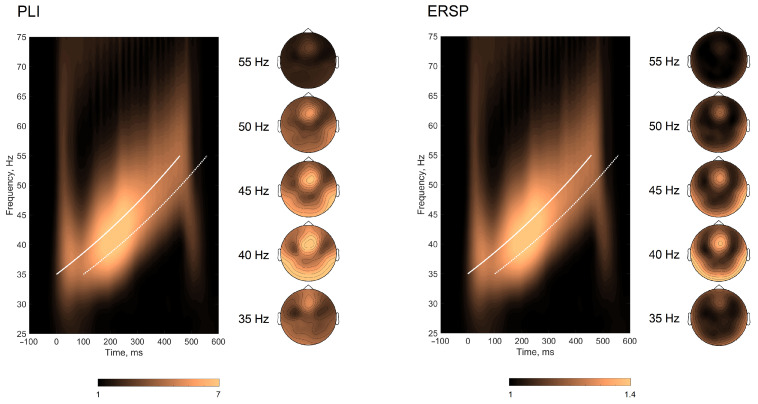
Figure 2.
Time-frequency plots of PLIs and ERSPs for envelope following response. The white solid line corresponds to the course of auditory stimulation; the white dashed line denotes +100 ms window from the stimulation line. The grand-averaged topographies for envelope-following response at 35, 40, 45, 50, and 55 Hz stimulation are presented alongside the time-frequency plots.

