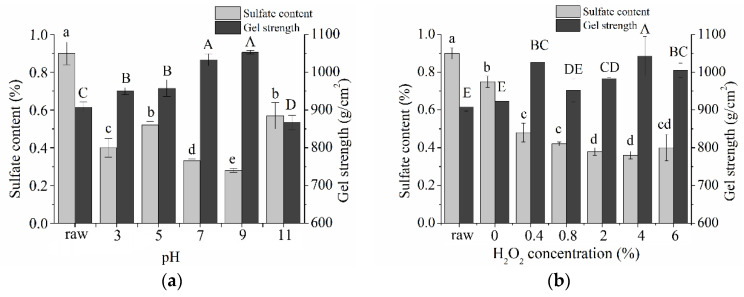
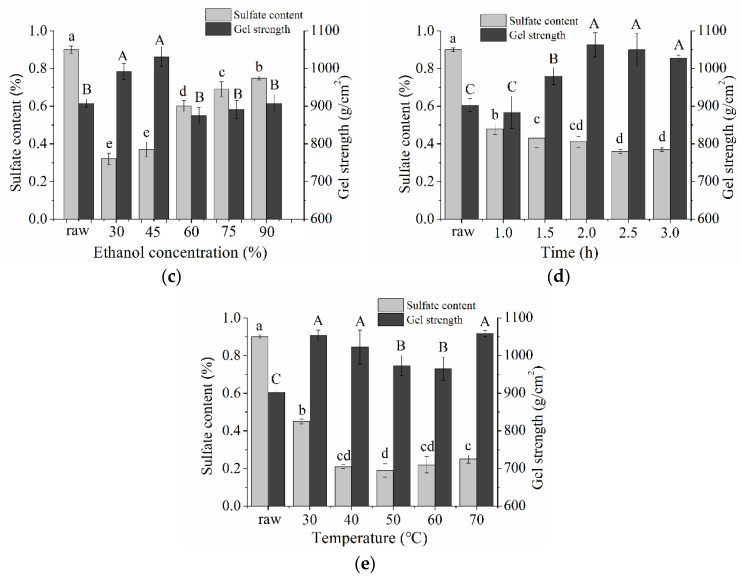
Figure 1.
Effects of reaction conditions on agar desulfation. (a) Reaction pH; H2O2 concentration 4%; Ethanol concentration 30%; Reaction time 2 h; Reaction temperature 30 °C. (b) H2O2 concentration; pH 9.0; Ethanol concentration 30%; Reaction time 2 h; Reaction temperature 30 °C. (c) Ethanol concentration; pH 9.0; H2O2 concentration 2%; Reaction time 2 h; Reaction temperature 30 °C. (d) Reaction time; pH 9.0; H2O2 concentration 2%; Ethanol concentration 45%; Reaction temperature 30 °C. (e) Reaction temperature; pH 9.0; H2O2 concentration 2%; Ethanol concentration 45%. The reaction was carried out by changing one parameter in each case while holding the four other parameters constant (pooled data from three experiments are presented as means ± standard deviation of the mean (n = 3)). “raw” indicates untreated raw agar. a, b, c, d, e on the bar graph indicate significant differences in sulfate content, and A, B, C, D indicate significant differences in gel strength (p < 0.05).


