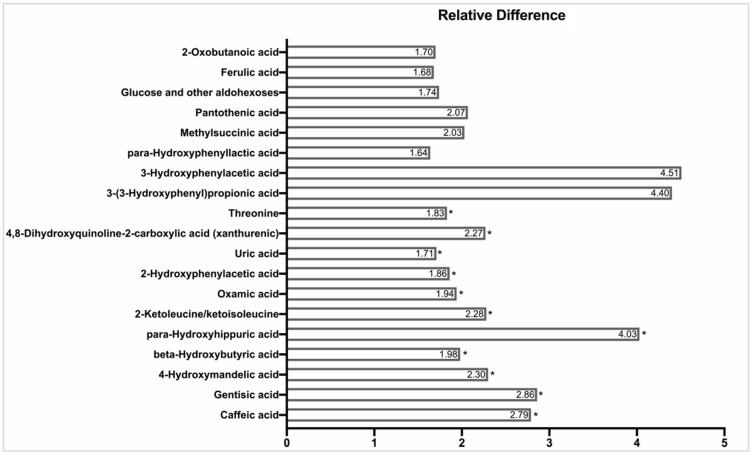
Figure 2.
Relative Difference in Nominally Significant Metabolites from Untargeted Urine GC/MS during Randomized DASH and Control Feeding Periods. Relative difference represents the ratio of peak areas by GC/MS. Differences are tested using generalized estimating equation models evaluating the difference in log2 peak areas in non-missing samples obtained during randomized study weeks on either DASH or Control diet. Relative differences re-express absolute log2 difference coefficients (β) as 2β. Significance at a false discovery rate (FDR) adjusted p < 0.20 is indicated by an asterisk (*). Metabolites are ordered by statistical significance with the most statistically significant metabolites beginning at the bottom near the x-axis. Several metabolites had between 10–20 imputed values including caffeic acid, gentisic acid, uric acid and threonine.

