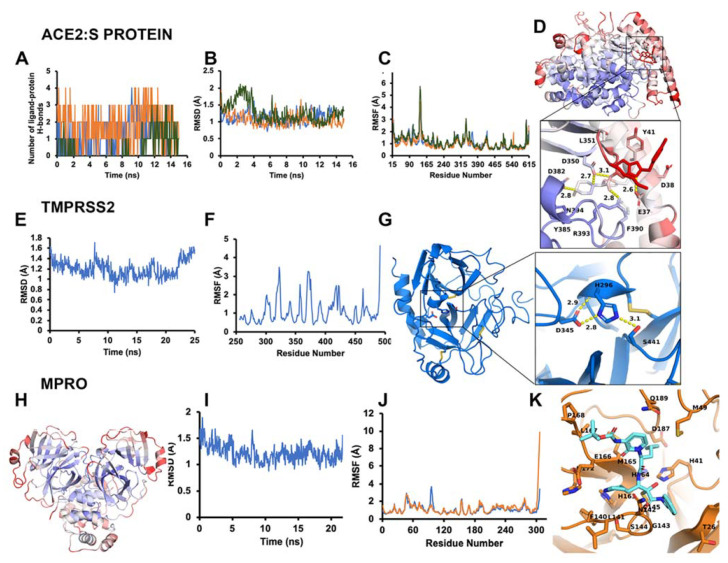
Figure 4.
Modeling requires molecular dynamics to reflect optimal inhibitor-binding sites. (A–D) ACE2–S protein stabilization and effect of ligand binding at allosteric site. (A) Number of hydrogen bonds for each ligand with ACE2 against each frame of the simulation. Blue is ligand 300, orange is ligand 392, green is ligand 488. (B) RMSD of ACE2 across every frame in the simulation, bound to different ligands. (C) RMSF per residue of ACE2 in each MDS bound to different ligands. (D) RMSF heat-mapped onto ACE2 and ligand 300. A call-out box shows a close-up of ligand and binding site. Ligand and binding site residues represented as sticks with labels and interaction distances. The scale is a BWR gradient from 0 to 2.0 Å RMSF. (E–G) TMPRSS2 dynamics reveal the catalytically active form suitable for inhibition. (E) RMSD in Å across the 25 ns MDS trajectory mapped as a 2D plot. (F) Per residue average RMSF in Å across the trajectory mapped as a 2D plot. Disulfide bonds and catalytic triad are represented as sticks. The scale is a BWR gradient from 0 to 2.0 Å RMSF. (G) Post-cleavage (mature protease) extracellular domain of TMPRSS2. Call-out box shows close-up of canonical serine protease catalytic triad of mature TMPRSS2, with distances of polar contacts. (H-K) Model refinement for Mpro reveals ligand-binding sites suitable for docking. (H) Average RMSF per residue heat-mapped onto the Mpro structure. The scale is a BWR gradient from 0 to 2.0 Å RMSF. (I) RMSD of Mpro for each frame of the simulation. (J) Average RMSF per residue of Mpro (each chain measured separately). (K) Mpro (orange) with small-molecule inhibitor (cyan).

