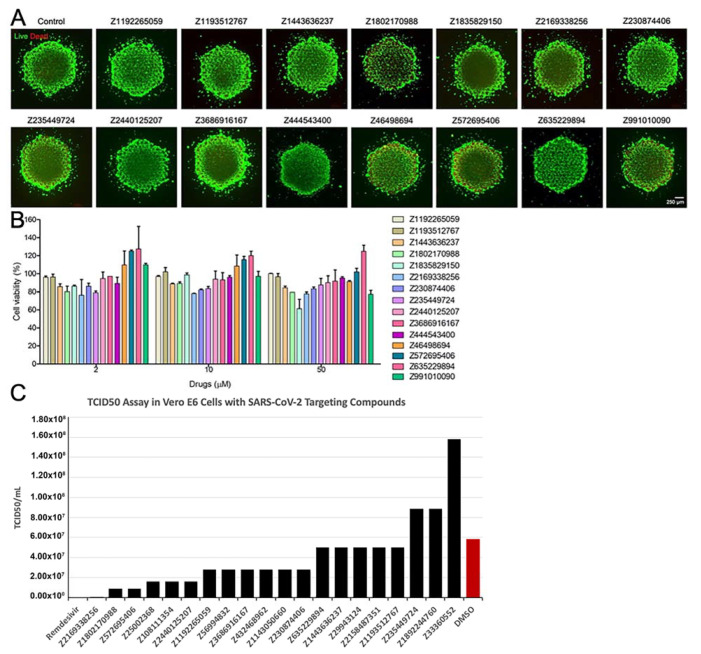
Figure 7.
In vitro compound evaluation. (A) Fluorescence images showing live (green)/dead (red) staining after 24 h of treatment by the compounds (50 µM). (B) Quantification of cell metabolic activities by the MTS assay after 24 h of treatments by the compounds at different concentrations. (C) Quantification of TCID50 assay in Vero E6 cells when treated with Remdesivir, DMSO, or a SARS-CoV-2-targeting compound.

